
Photo Credit: Maddy Meyer/Getty Images
By: Spencer Fascetta | Follow Me on Twitter @PuckNerdHockey
Anybody else sick and tired of the great David Krejci debates? Y’know, the ones where people claim that he sucks, and is overpaid, and needs to be traded immediately? So, I decided to take a look at it. The following are a series of graphs I constructed using data from this past season, and over Krejci’s entire NHL career, to demonstrate that he is an integral part of this team.
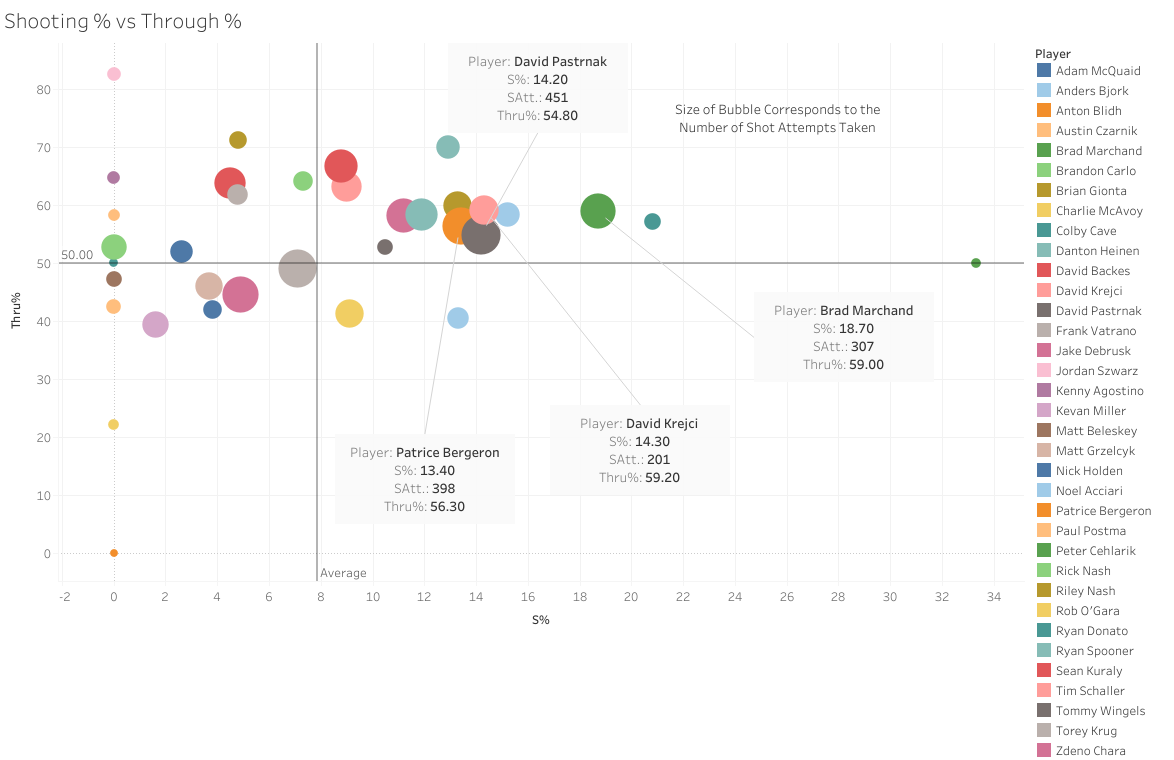
Let’s start with a comparison of shooting percentage to the percentage of shot attempts that actually hit the net. The size of each bubble corresponds to the volume of shots by the individual player. Clearly, Brad Marchand is one of the B’s most prolific scorers. He is very deliberate in his shot selection to ensure that he has a higher than average through percentage. Believe it or not, Krejci’s through percentage is actually higher than Marchand’s (albeit with approximately 100 fewer shot attempts). He had a higher shooting percentage than both David Pastrnak AND Patrice Bergeron this year. He is still clearly an offensive weapon for the B’s.
<a href=’#’><img alt=’ ‘ src=’https://public.tableau.com/static/images/20/2017-18BruinsPointShareAnalytics/PointShareComparisonTotalTeam/1_rss.png’ style=’border: none’ /></a>
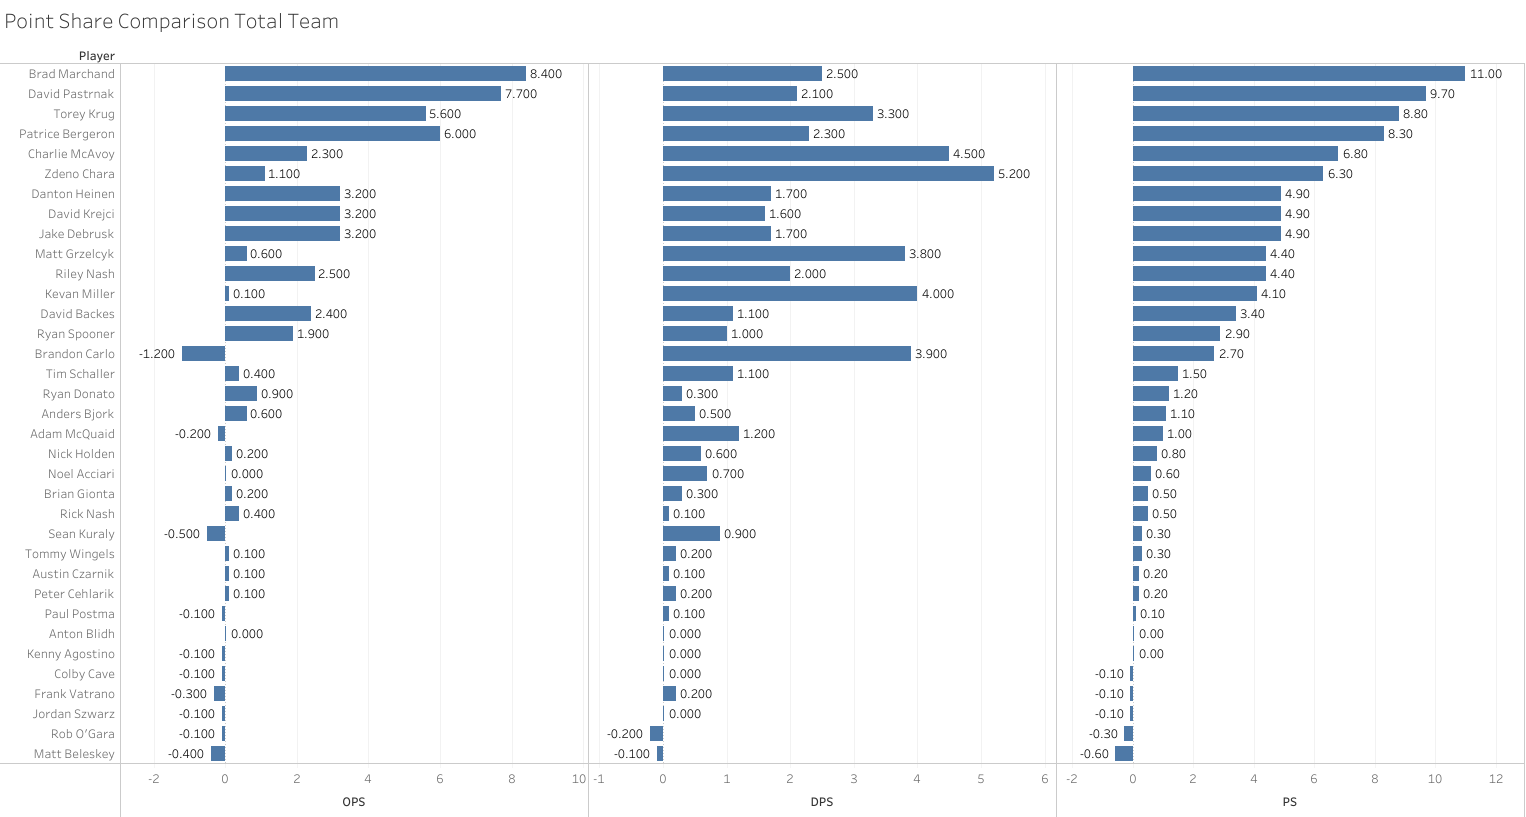
Let’s analyze point shares. A point share is the estimated contribution from each player to a team measured in the number of standings points he and his performance were worth in a given year. Obviously, the top five in this category should surprise nobody. The Marchand/Pastrnak/Bergeron line was utterly dominant. Charlie McAvoy de-aged Zdeno Chara by about 15 years. What is interesting is the next four. Danton Heinen, David Krejci, and Jake DeBrusk were all worth just under five points in the standings. Matt Grzelcyk was the third-most-valuable defenseman on the roster. This is not the time for a Matt Grzelcyk love-fest (you get plenty of those from me anyway), so let’s focus on the three forwards. Heinen played on almost every line this year, but Krejci and DeBrusk were attached at the hip. They are very clearly second-line players on this team and contribute both offensively AND defensively.
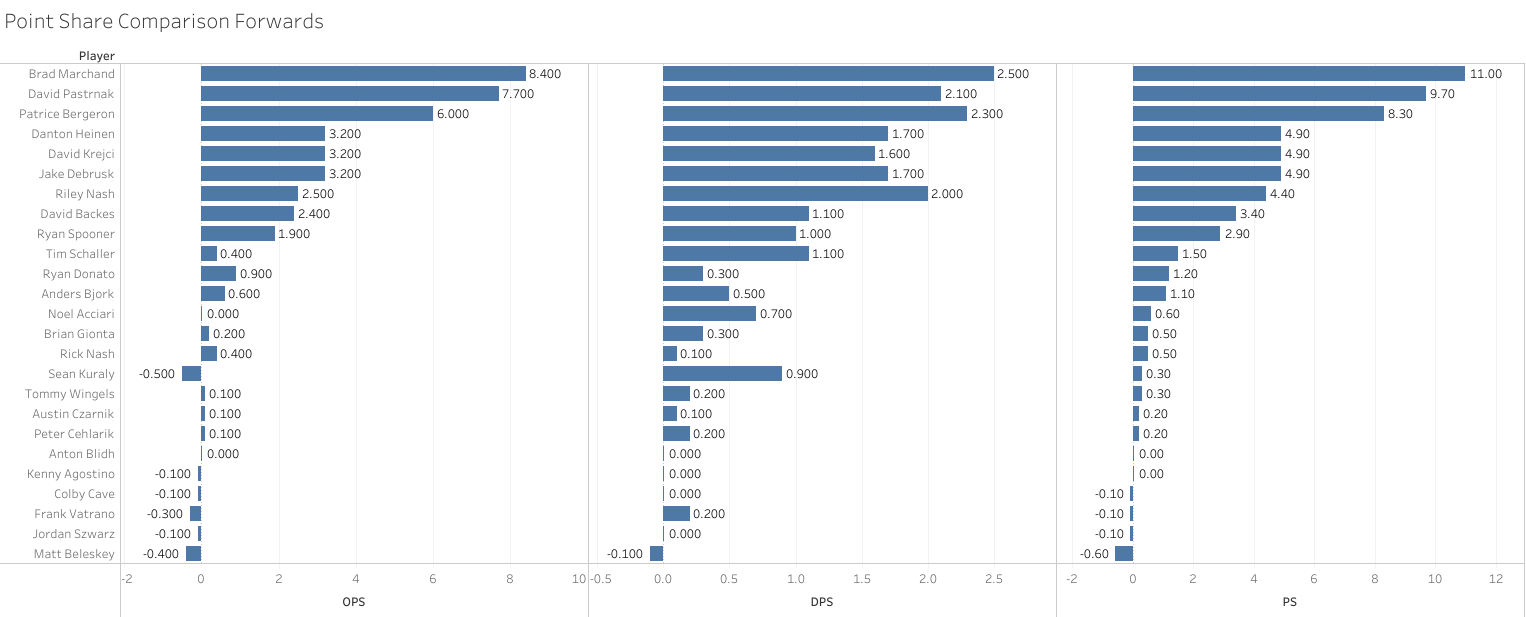
This second point share comparison handles only the forwards to can emphasize the importance of Krejci’s contributions. The Bruins had seven forwards worth more than 4 points in the standings this year — Pastrnak, Marchand, Bergeron, DeBrusk, Heinen, Krejci, and Riley Nash. Unsurprisingly, much of Nash’s contributions came on the defensive side of the puck. You can ALSO see that, after Krejci’s three-way-tie, the contributions drop off very quickly.
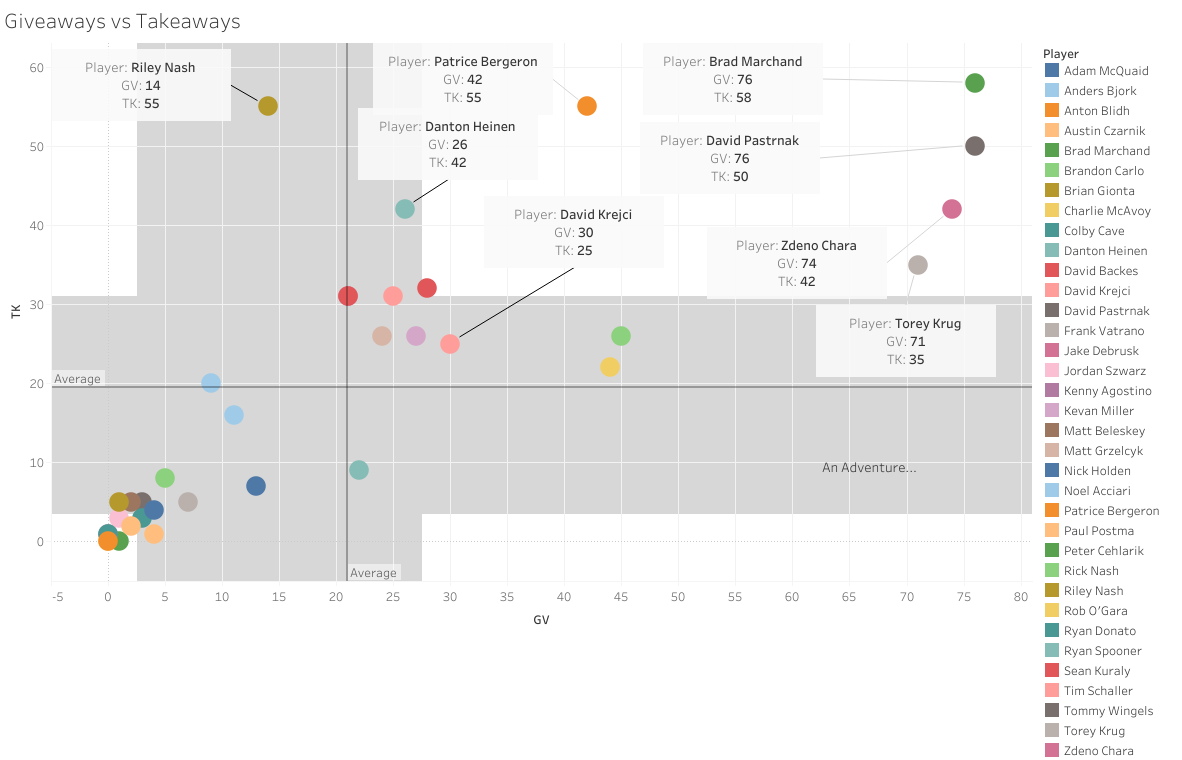
How about the difference between players who have a lot of giveaways to those with a lot of takeaways. Riley Nash might have been the safest player with the puck all season, with nearly four times as many takeaways as giveaways. One would expect players who have the puck a lot (hello Bergeron, Pastrnak, Marchand) to have high numbers in giveaways and takeaways, and offensively dynamic players such as Pastrnak and Marchand will often have more giveaways than takeaways due to how insanely risky their offensive abilities are. This is also why they are so dynamic and dangerous, so that is a necessary risk in order to be successful. I’m unsurprised by Torey Krug’s differential here — he falls into a similar category as Marchand and Pastrnak. Zdeno Chara’s differential is relatively concerning, especially given that he played the majority of the season stapled to Charlie McAvoy, who was far less turnover-prone. Danton Heinen appears to be a defensive stalwart, and Krejci is not inherently risky with the puck.
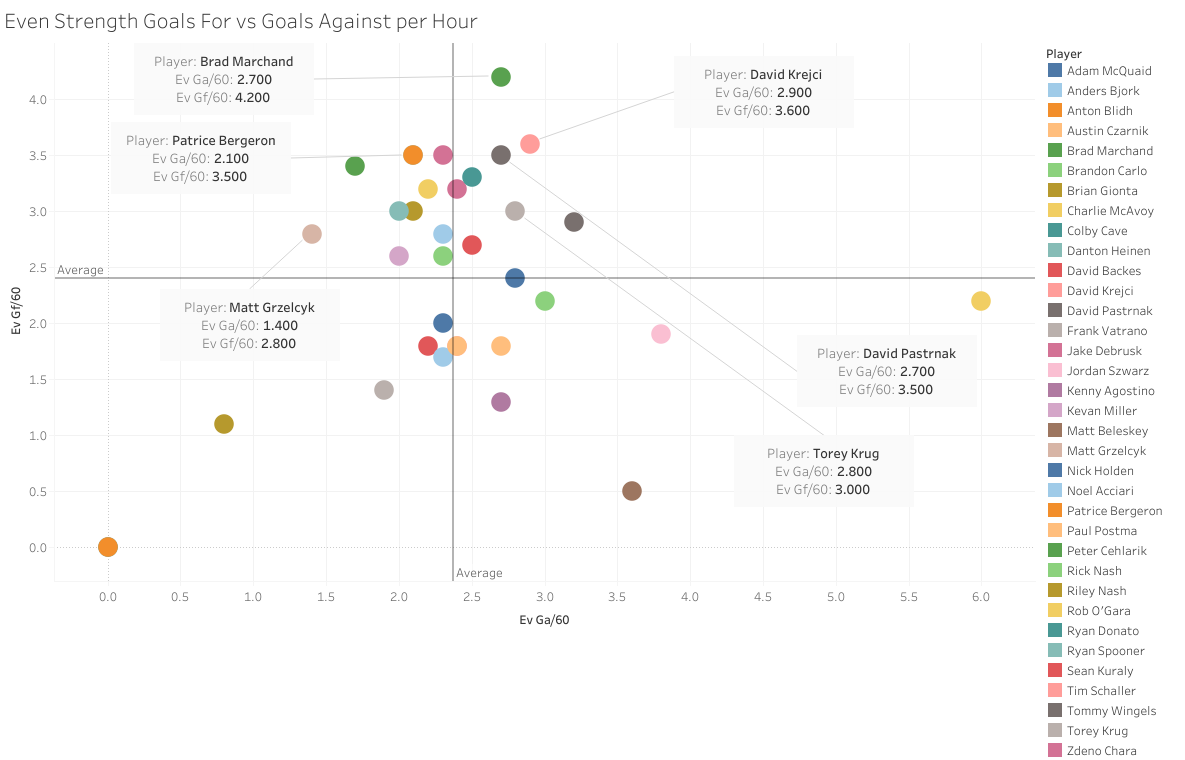
When adjusting for how much time on the ice each player spent, you can gain a better understanding of how effective they are in the time they are given. As you can see, Krejci actually was the second-most dangerous offensive player on the team behind Marchand, generating more than 3.5 goals-for per hour of even-strength ice time. He also had a differential between goals for and against comparable to that of David Pastrnak.
So, now that we have thoroughly proven that David Krejci was an excellent player this past year, how about we look at his entire career in Boston? The next three graphs were developed using Corsica.hockey’s linemates tool. Each pairing are players that played at least 100 minutes as David Krejci’s linemates in his career. There are some consistent names, ones you would expect. Milan Lucic and Nathan Horton played by far the most with Krejci in his career — that line was dominant in the 2011 Stanley Cup run. If it felt as if Milan Lucic was stapled to Krejci for a while, he was. Around half of the lines Krejci has spent at least 100 minutes with, Lucic has been a part of it. David Pastrnak has also been a frequent linemate of Krejci, with the two crossing paths at the end of Lucic’s Boston tenure.
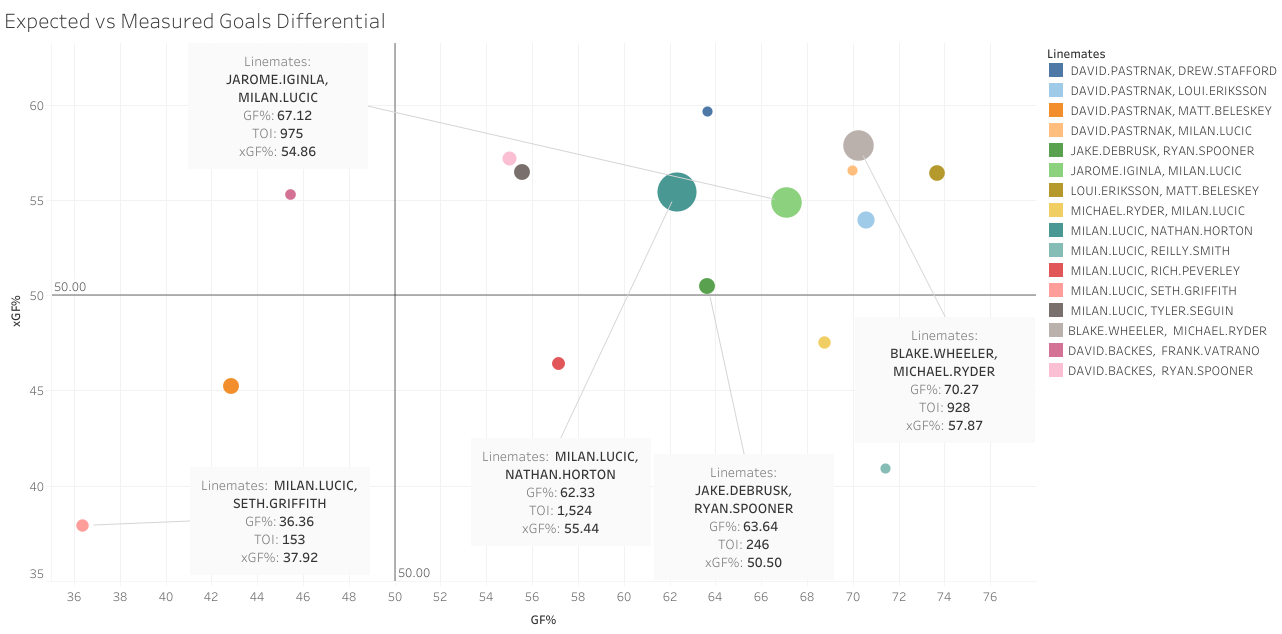
I compared the percentage of expected goals for each line in the sample to the percentage of goals for they actually produced while a line. The size of each bubble corresponds to the length of time they were a line. The Krejci/Lucic/Horton line was quite good in a large sample size – not unexpected. Jarome Iginla seems to have been a better fit in that spot instead of Horton. Slightly painfully for Bruins fans is the success of the Blake Wheeler/Michael Ryder combo on Krejci’s wings — they spent the third-longest time with Krejci as a line and were arguably one of the most successful groups he has seen in his career. This past year, although there seemed to always be a rotating cast of wingers to go with Krejci and DeBrusk, the most frequent of them (prior to being traded) was Ryan Spooner. While they weren’t as prolific as many of the other lines Krejci has been a part of, they still produced at a relatively good rate. I also highlighted easily the worst line he has ever been a part of — centering Lucic and Seth Griffith. It will become quite clear just how bad this line was.
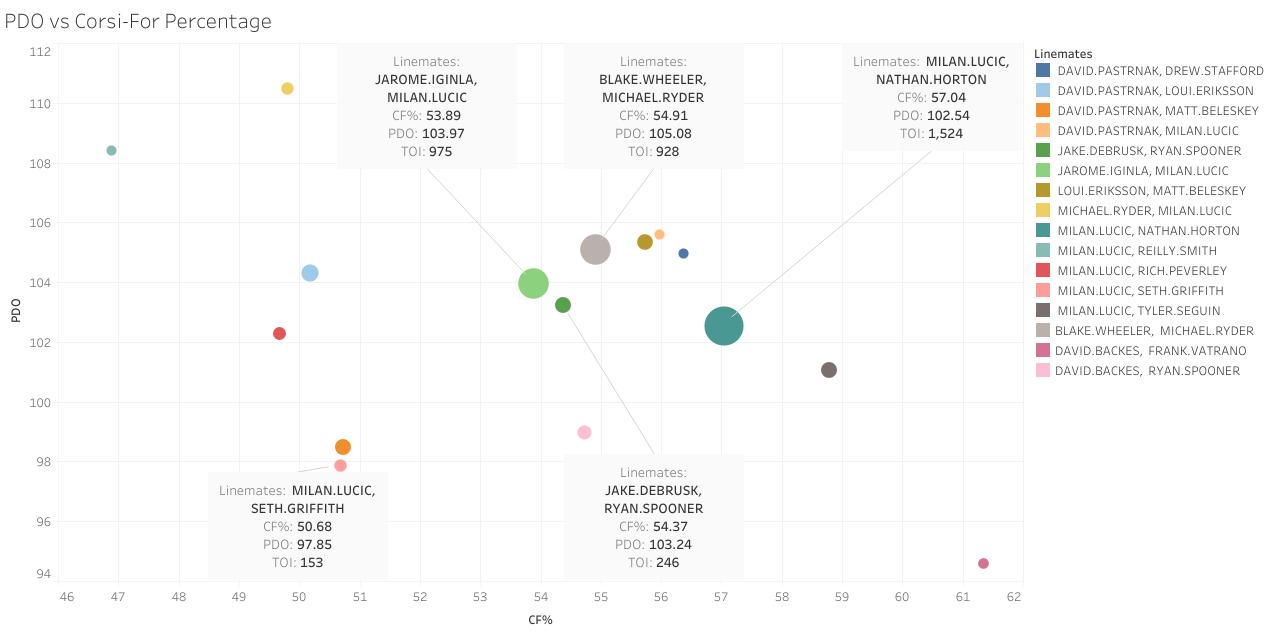
PDO, or hockey’s “luck” statistic, is the sum of a player’s on-ice shooting percentage and on-ice save percentage. Over a large sample size (i.e., a full season), the average player will see his PDO regress towards 100. Corsi For percentage is the percentage of shot attempts taken while a player is on the ice by his team compared to all shot attempts made while he is on the ice. It is meant to estimate puck possession, as in order to make a shot attempt, you must first have the puck. Many of Krejci’s lines had PDOs well over 100 — given the time he spent with Lucic/Iginla, Wheeler/Ryder, and Lucic/Horton, I’d say that Krejci’s influence on those lines means that the higher-than-average PDO levels are not an outlier. He seems to consistently influence his team’s on-ice shooting percentage in a very positive manner. This is also true of the DeBrusk/Spooner pairing, which demonstrates that this is a skill he has maintained throughout much of his career. The Lucic/Griffith pairing? Yeah, told you they were not exactly good. Nearly every single-line combination Krejci spent time within this sample had a Corsi For a percentage of at least 50%, meaning they controlled more than half of the shot attempts while he was on the ice. Over his entire career. That is not a coincidence.
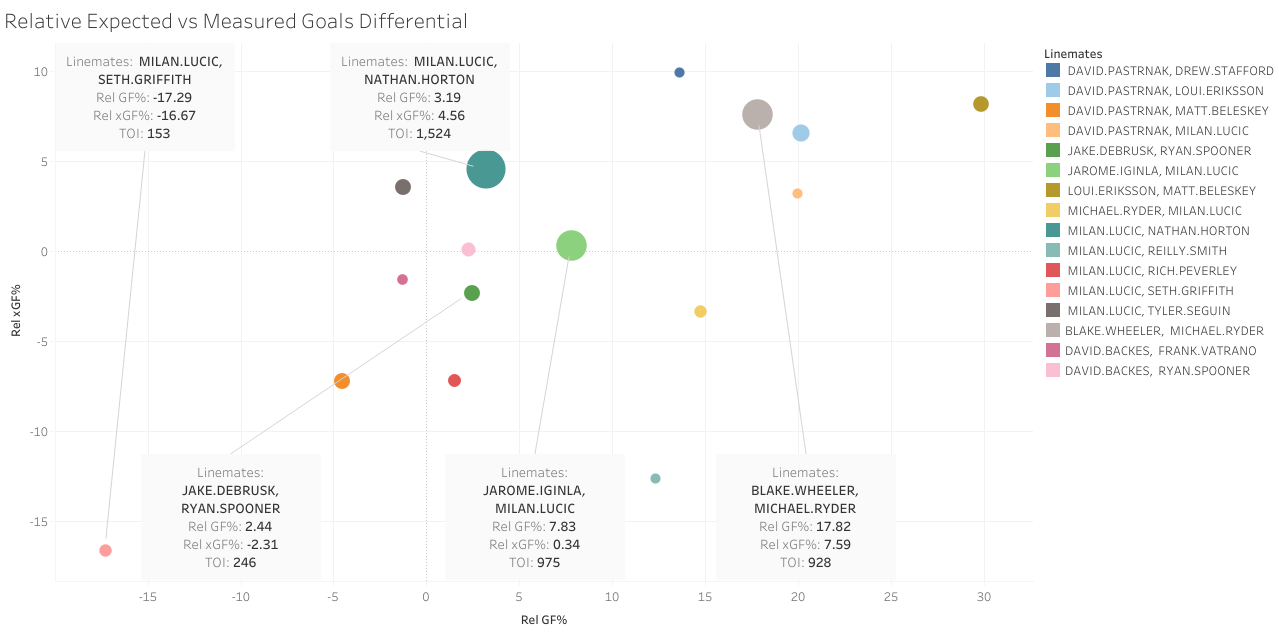
How good were they in relation to the rest of the team? Well, Wheeler/Ryder seemed to do a lot of the heavy lifting — if memory serves correctly, they were a line predominantly before the Bergeron/Marchand dynamic duo was discovered. Almost all of the line combinations have positive Relative Goals For percentages, meaning the team was producing more with them on the ice than off. The expected ratio is a little more telling, with the DeBrusk/Spooner combo showing some of its weaknesses here. And again, that Lucic/Griffith combo was really, really bad.
“But he’s overpaid!” you exclaim. Well, let’s analyze some comparables using CapFriendly’s contract-comparison tool. 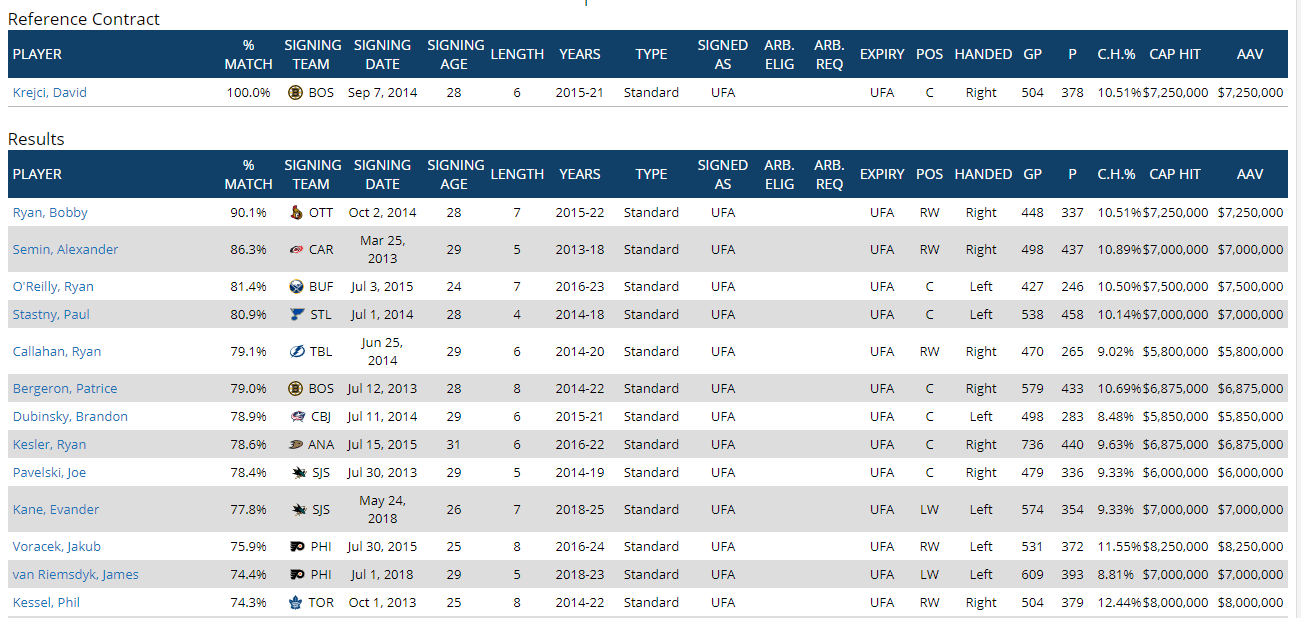
Bobby Ryan is the most-apt comparable — not a great start. Neither is Alex Semin at No. 2. But Ryan O’Reilly, Paul Stastny, and — ooh, look! Patrice freaking Bergeron! David Krejci is not overpaid. He is paid about what he is worth. So why is there this overarching narrative that he is a bum who needs to go? I think it can be attributed to a few factors. For one, he isn’t named Patrice Bergeron. That’s a difficult standard to meet. Also, he makes MORE than Bergeron (but Bergeron signed his contract before Krejci did, and Krejci did so after several years of the Horton/Lucic line combination dominating). The notion that he is injury-prone isn’t entirely accurate. Aside from the 2014-15 season, where he dealt with a major shoulder injury, he has never missed more than 10 games in any given season since becoming a full-time member of the Bruins. He has led the playoffs in scoring twice — in 2013 and during the 2011 Stanley Cup win. He is an indispensable member of the Boston Bruins. If you are going to trade him, fine. But you better be getting another David Krejci back in return if you have any desire to continue being a perennial Cup contender.
Or, you could just mindlessly hate him. It’s Boston. There really doesn’t tend to be logic behind much of the anger displayed around here.

Leave a Reply