
By: Dominic Tiano | Follow me on Twitter @dominictiano
I’m not talking about the on-ice product. More specifically, they are in an excellent position to do something about the on-ice product. Compared to the other 15 (current) playoff teams, there are only two teams in a far superior situation to the Bruins.
But as deadline day approaches, it gets more complicated than just the dollars for this season. If a team is looking to acquire player(s) with term, taking into account the 2022-2023 season is paramount. Take the New York Rangers, for example. While they have plenty of money to play around with for this season, they only have about $8.6 million in cap space for next season with key free agents to sign- Kaapo Kakko, Alex Georgiev, and Ryan Strome, to name a few. They are also facing a potential $7.1 million in performance bonuses. With their cap situation being tight for next season, they will want to make sure that the entire amount fits under the cap this season.
Nashville is in excellent shape, though, for this year and next. They have about $25 million in space for next season, with Filip Forsberg as the “big one” to sign.
In the chart below, you will see three sets of numbers. Let me begin with Projected Space. Projected space is the amount of cap space a team will have at the end of the season if their roster remains unchanged between now and the end of the season. The teams with projected space are banking cap space. As a student, I was never a fan of homework unless it came to math, and then I did extra. It’s not an important number, but I am including it for you in the event you want to do some math homework.
The important number is Current Cap Space. Because (some) teams have been banking cap space, you’ll see a current cap space higher than the Projected Cap Space. That number grows every day they are banking cap space. What that means is a team can add a player(s) today whose AAV is equal to or less than the Current Cap Space without having to move out salary and still be cap compliant by the end of the season. There is no prorating to be done here; it is a player(s) full AAV that can be added.
An out-of-this-world example: Nashville has $24,796,940 in current cap space. They could add Auston Matthews ($11,640,250) and Mitch Marner ($10,903,000) today without moving any salary and still be cap compliant at the end of the season.
The last column is LTIR Space. Teams that have zero projected space and only LTIR space are not banking any cap space, therefore, are limited to the LTIR space they have when making an acquisition. Unless, of course, they are moving salary out. A team like Vegas, for example, has to worry about injured players returning like Jack Eichel and Alec Martinez. They are already in a position where they are going to have to move out salary before Eichel can be activated. I won’t break down every team’s roster for you, but if you want to check them out, I suggest using CapFriendly.
So, what does this mean for trade deadline day?
Earlier I said that teams are banking cap space every day they are under the cap, and if you check CapFriendly daily, you will see the current cap space increases every day. If you want to see where everyone stands on trade deadline day, then use this formula:
Projected Space / 40 (that’s the number of days remaining in the season after the trade deadline)
Multiply that answer by 200 (that’s the number of days in the NHL season).
Note: There are usually 186 days in the NHL season, but the whole Olympic fiasco raised it to 200 for this season.
That will give you the AAV a team can add on trade deadline day and still be compliant at season’s end. Reminder: That is the player’s full AAV that can be added – no prorating required. For teams on LTIR, their LTIR space is the total AAV that can be added and still remain compliant at the end of the season (teams will have to have space for any players that may return from LTIR).
| TEAM | PROJECTED CAP HIT | CURRENT SPACE | PROJECTED SPACE | LTIR SPACE |
| Nashville | 70,725,075 | 25,057,963 | 10,774,924 | – |
| Rangers | 73,897,433 | 16,386,074 | 7,602,567 | – |
| Minnesota | 79,229,724 | 5,279,712 | 2,270,276 | – |
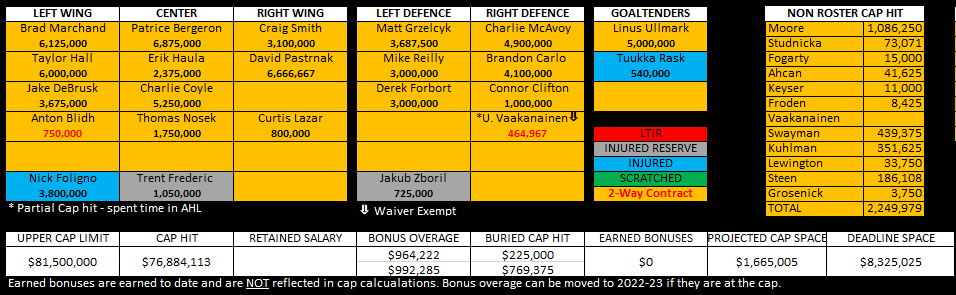
| Boston | 79,834,995 | 3,872,105 | 1,665,005 | – |
| Calgary | 80,388,350 | 2,585,233 | 1,111,650 | – |
| Los Angeles | 81,329,069 | 554,396 | 6,371,584 | |
| Colorado | 81,624,076 | 287,716 | 1,691,667 | |
| Florida | 81,934,579 | 88,540 | 3,898,348 | |
| Toronto | 82,016,225 | 1,305,128 | 561,205 | – |
| St Louis | 82,143,724 | 63,720 | 148,186 | – |
| Carolina | 83,504,050 | 0 | 1,801,500 | |
| Pittsburgh | 83,724,281 | 0 | 4,000,000 | |
| Washington | 85,745,777 | 0 | 224,167 | |
| Edmonton | 87,414,260 | 0 | 2,629,637 | |
| Tampa Bay | 89,144,099 | 0 | 0 | |
| Vegas | 91,048,896 | 0 | 5,738,333 |
As I said in the opening, the Bruins may not be in an ideal situation on the ice, but General Manager Don Sweeney and Assistant General Manager Evan Gold have positioned themselves to do something about it. Now, it comes down to a willingness to do something and the costs involved in terms of assets.
Just a note about Jake DeBrusk: How much the Bruins gain in cap space is dependent on what day he gets traded if he gets traded. His entire $3,675,000 cap hit does not come off the books. This is day 114 of the NHL season, so for that amount of time, he will continue to count against the cap. But the sooner a deal is done, the sooner they can bank that space.

Leave a Reply