By Karoline Sears | Follow me on Mastodon: @spelled_with_a_k and Substack
It’s time to say goodbye to our favorite playoff meme: Playoff Krejč. This being a Bruins Stats Corner, I have to ask, was Playoff Krejč a real phenomenon or just a legend? David Krejčí is finally hanging up his skates and moving on to the next chapter of his life. We can’t know for sure who will take his place, but we can look back fondly on what he brought to the post-season.
Turn it Up
While most players bring a raised level of intensity to playoffs, Krejčí has had the uncanny ability to convert that intense energy into results. It always seemed like he was in the right place at the right time, making the perfect tape-to-tape pass, or faking out a defensive opponent with poise. My colleague, Tommy Bennett, has written a great piece on some of Krejčí’s best moments.
I wanted to explore just how much Krecho raised the bar in the post-season. Since there aren’t nearly as many games played in the playoffs as there are in the regular season, it’s important to look at percentages when comparing these two time periods. This means I am calculating how much he can do within a defined period of time if we control for the difference in length of time. I’ve pulled data on Krejčí career from NaturalStatTrick.com.
Shooting Percentage
Since a straight comparison of goals scored between the regular season and post-season is not an equal comparison, I took a look at shooting percentage. It’s a great, simple statistic computed by multiplying goals scored x 100 divided by shots taken. It essentially determines what percent of all of the player’s shots resulted in a goal. The higher the percentage, the more efficient and better a goal-scorer the player is.
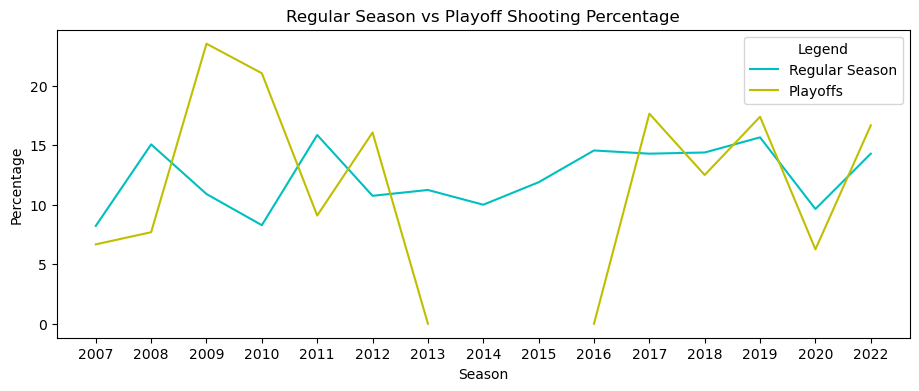
While I went into this analysis with some skepticism (that’s my job as a data analyst, after all), I was honestly not surprised that Playoff Krejč actually turned it up in the post-season. His shooting percentage indicates that he was scoring on more of his shots in the playoffs than in the regular season over the course of most of his playoff appearances.
I want to note that the drop off in playoff shooting percentage in the graph above indicates that he had a 0% – in the 2013-2014 post-season Krejčí did not score any goals and the following two seasons the Bruins missed the playoffs entirely. You will see this trend in the other visuals below, too.
Overall Individual Points Percentage
If you’ve been reading my articles for a little while or following my blog, you know I love the Individual Points Percentage (IPP) stat. As a quick refresher, IPP calculates the frequency the player earns a point while on the ice when a goal is scored. The average IPP for forwards is 68%; meaning, the average forward player should earn a point while on the ice 68% of the time.
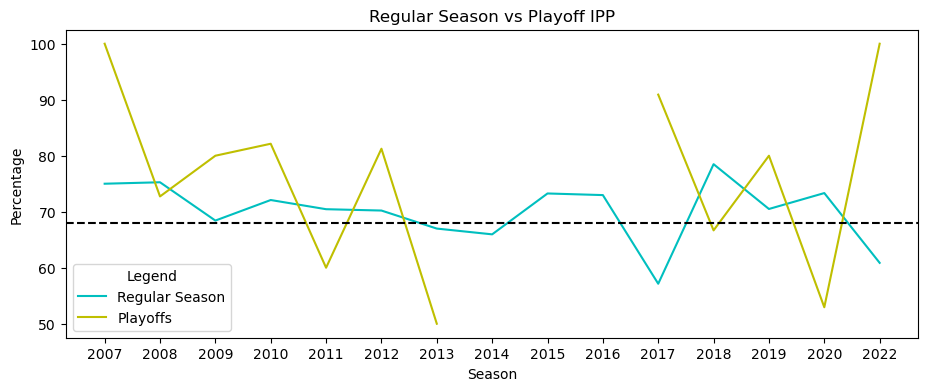
Once again, Krejčí became Playoff Krejč in the post-season. With the exception of three post-season years, Krejčí was above average in his IPP stat. He was also above average in every year of his career except for three seasons. That is truly astonishing.
Corsi For Percentage
Corsi is any shot attempt (i.e., goals, shots on net, misses, and blocks) outside of the shootout. There are a lot of ways to repackage this general stat; you can look at Corsi For (the player’s shots against a team), Corsi Against (shots made by opponents when that player is on the ice), Corsi For Percentage (the percentage of total shots while that player is on the ice that is for that player’s team), and so on and so forth.
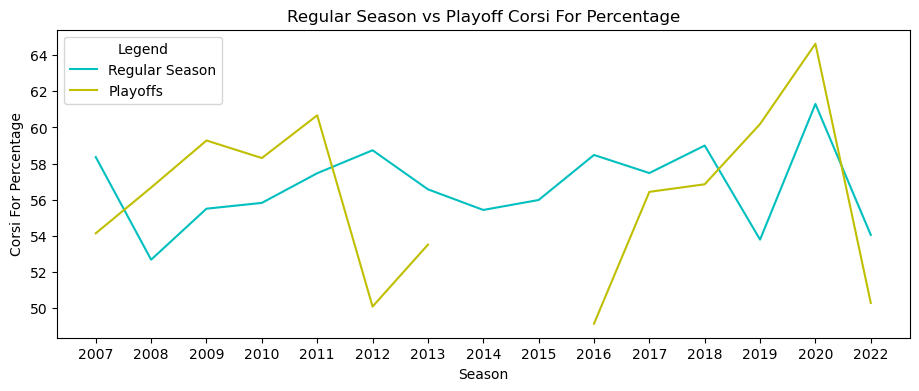
In the graph above, I compared Krejčí’s regular season and playoff Corsi For Percentage (CF%). Again, at this point, you should not be surprised to see the difference between his regular-season performance and his playoff performance. He just unleashed a barrage of shots in the direction of the net in a way he did not during the season.
Danger Scoring
I love looking at danger scoring and danger saves; If you recall from previous articles, I mention high, medium, and low danger. In the hockey data science world, the value of a shot/goal is assessed based on the location of the shot. The closer to the crease, the higher the danger. Analysts use this data to determine if a forward is able to score goals in those tough, gritty spots and if a goalie can make saves when there are a lot of bodies next to him.
Once again, we are using a percentage to compare the two time period of the regular season and post-season. This means the formula is adjusted to calculate the percentage of goals scored in a particular location while Krejčí is on the ice for the Bruins. It’s not necessarily a measure of goals scored by Krejčí, but rather goals scored while Krejčí is on the ice.
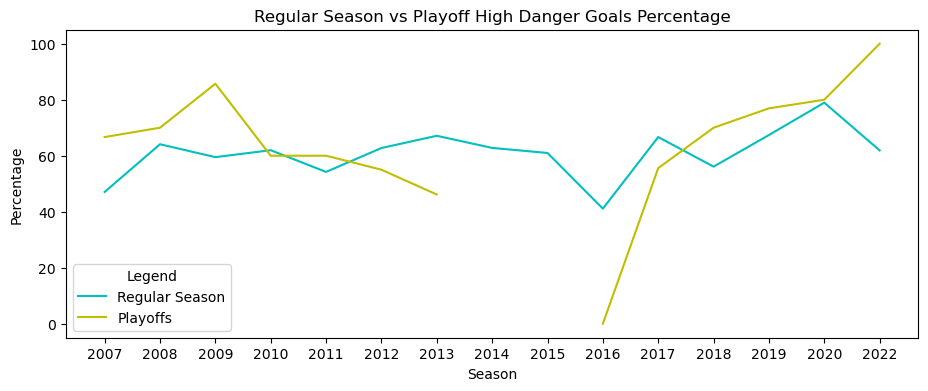
In seven post-season appearances (out of 13), Krejčí outperformed himself in High Danger Goals as a percentage (HDGF%) from the regular season to the post-season. In some of those seven post-season appearances, he was racking up a 60%+ HDGF% stat. This means he was on the ice for over 60% of goals that were scored in or around the immediate crease area.
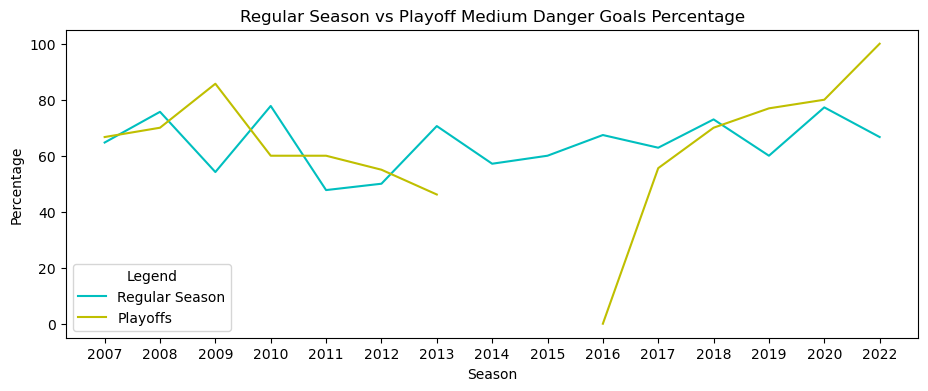
Krejčí also exceeded his regular season performance on the ice for Medium Danger Goals as a percentage in seven post-season years. These are goals scored from the side of the net near the crease and in the space between the face-off dots.
Who Comes Next?
As we inch closer and closer to the end of the modern Golden Era for the Boston Bruins, it’s important to stay optimistic about the future. Krejčí wasn’t the first clutch playoff Bruin and he won’t be the last. But I have to think he was one of the most underrated and understated centers in the league. The Bruins have a lot of young talent in the pipeline, waiting to make their mark on this century-old team. And we get to have a front-row seat to it. Thanks for the memories, Krecho.


Leave a Reply