
By Karoline Sears | Follow me on Mastodon: @spelled_with_a_k and Substack
Welcome to your weekly Bruins Stats Corner stats tracker round-up. Each week I will update this post within the month of October so we can all track this Centennial team. I have chosen some of my favorite stats to track: Defensive Points Share (DPS), Faceoff Wins Percentage (FOW%), Time on Ice (TOI), and Individual Points Percentage (IPP). Besides being my favorites, these were stats that Patrice Bergeron was king of and this is a good way to see how he is missed and how the Boston Bruins are coping without him.
As of October 22, 2023 at 9:00 am:
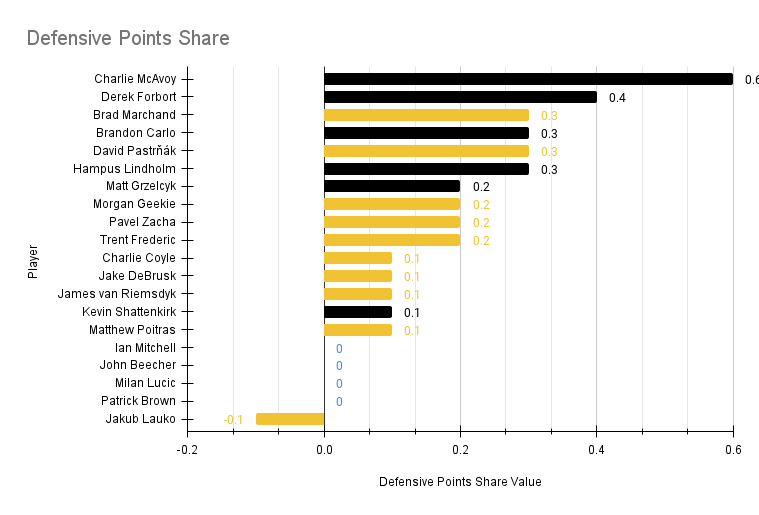
Defensive Points Share
DPS estimates the number of points a player contributes to their team’s success through defensive play. It considers ice time, plus/minus, penalty-killing performance, and defensive zone starts. Higher DPS values indicate strong defensive contributions. Hampus Lindholm led the league in DPS in 2022-2023 with 7.2.
It typically takes into account various defensive statistics, such as:
- Blocked Shots: The number of shots a player blocks to prevent them from reaching the net.
- Hits: The number of body checks or hits a player delivers, which can disrupt the opponent’s offensive plays.
- Takeaways: The number of times a player successfully takes the puck away from an opponent.
- Defensive Zone Starts: The percentage of a player’s shifts that begin in the defensive zone, which can indicate a player’s defensive responsibilities.
- Penalty Killing Time: The amount of time a player spends on the penalty kill, which is a crucial defensive role.
Faceoff Win Percentage
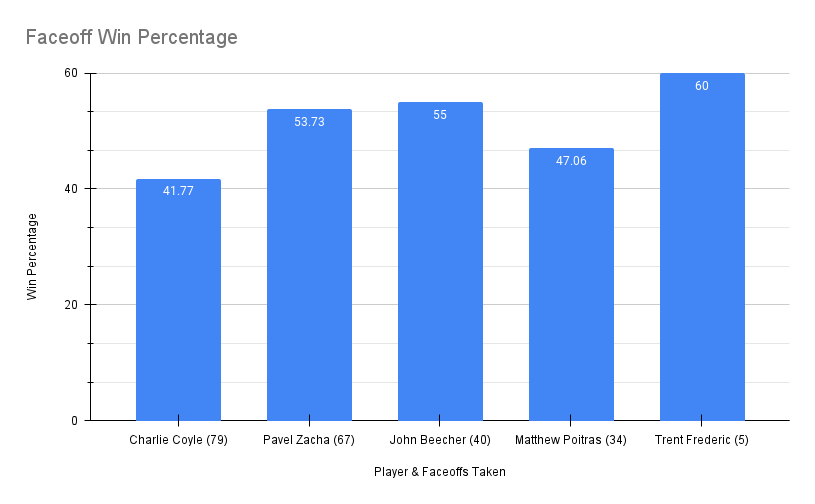
I don’t have to remind you of the absolute powerhouse that was Patrice Bergeron in the faceoff circle. In the last three seasons, Bergy posted a 60%+ FOW% and finished his career with a 58.9% FOW and he never dipped below 50.3% in 19 playing seasons with the Bruins. He teed up at the dot 22,447 times and in the 2022-2023 season, he racked up a six-year high of 1,706 faceoffs. I bring up faceoffs taken because it’s important to consider that when looking at FOW%. As you can see below, Trent Frederic may have the highest FOW%, but Charlie Coyle has been to the dot 79 times this season. Just because Coyle’s FOW% is less than Frederic’s doesn’t mean that he is “worse” at faceoffs than Freddy.
Time on Ice
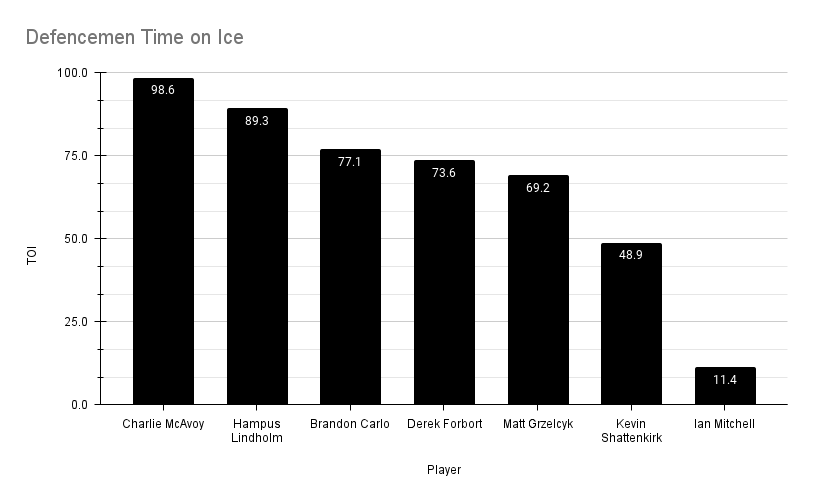
I’ve split up the TOI tracker between forwards and defencemen for the time being; If you’ve read some of my other posts, you know that I like to look at player usage, and that means blending both types of skating players’ stats. Since it is so early and the season, I’m keeping things simple. Especially as rosters are still being tweaked across the league.
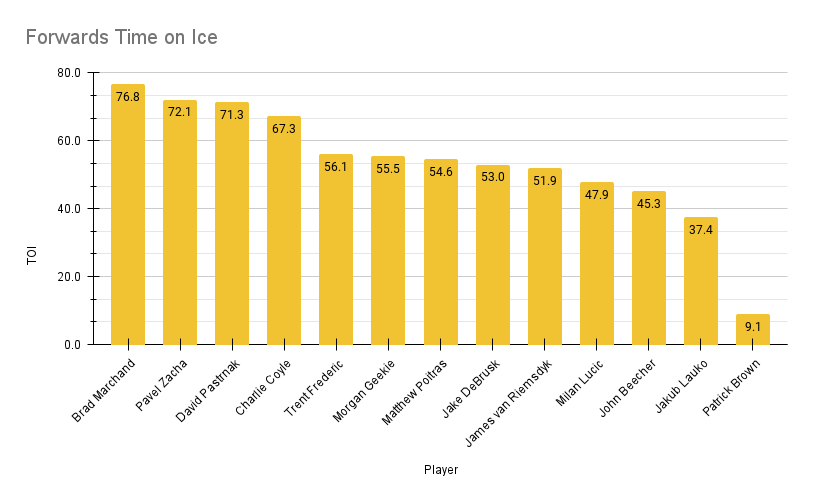
Much has been made of the type of captain that Brad Marchand will be, but one thing that everyone agrees upon is that he will lead by example. And at 35 years of age, he is still going all out on the ice and making things happen.
Individual Points Percentage
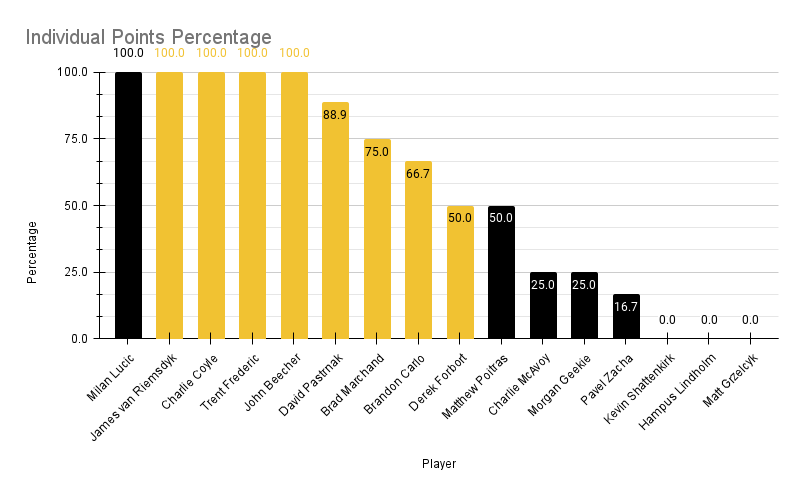
When it comes to offensive contribution, the IPP is also in the family of Points Shares statistics. When a player is on the ice, how often is he directly contributing to goals for his team – or even against? While it is still quite early, the stats are telling. Most of these 100s will start moving back down to the mean (~63% for forwards and ~38% for defencemen), but considering how the third and fourth lines have been really connecting well on the ice, it is no wonder that players from those lines are contributing the most right now.
A “0.0” above a player indicates that he has been on the ice for goals, but did not earn a point from the goal. If a player is missing (i.e., Patrick Brown, Jake DeBrusk, Ian Mitchell, and Jakub Lauko), that means they have yet to be on the ice for a goal at all.


Leave a Reply