
By Karoline Sears | Follow me on Mastodon: @spelled_with_a_k and Substack
I’ll be honest with you when I first heard the rumor that Milan Lucic wanted to come back to Boston, I was not only skeptical, but I was totally against the idea. Over the past few years, it seems like the Bruins’ front office is only interested in “keeping the band together,” even if the members are past their prime. I am ready for a new, young Bruins crew that will form the core memories for my own 6-year-old.
However, on July 1st, when the rumor became a fact, I found myself reflecting on the Boston Bruins of the early 2010s. And you know what? I started to get excited about the return of “Looch.” I remember him as this modern-day “Big Bad Bruin” who threw his weight around, made plays, and was a significant personality on the team, second only to the Rat King himself, Brad Marchand.
This trip down memory lane prompted my question for this week’s Bruins Stats Corner: is he still the Lucic we know and love? He was such a good player, so good that he priced himself out of Boston and ended up on the trading block. (Sidebar: was that trade worth it? Boston drafted Jakub Zbořil from that trade chip, so you be the judge.) Let’s look at what Looch has been up to in the last eight years and what we might expect from this 35-year-old winger. He might not be posting the same numbers as he once did, but at his core, I think we will not be disappointed.
The Man, the Myth, the Legend
It’s pretty clear to me that Lucic wants to retire as a Bruin, and he was willing to come to Boston for a very team-friendly price. I’ve pulled data from his entire career regarding hits, penalties, goals, and ice time (“TOI”). All of the data came from MoneyPuck.com and NaturalStatTrick.com. In the sections below, the season year listed is the year in which the season began. For example, the 2009 season represents the 2009-2010 NHL season. I have also noted the years in which he moved to a new team.
Hits
If there is one thing Milan Lucic continues to excel at, even in the twilight of his career, it’s giving hits. The 6’3 “, 231-pound forward has never been shy about literally throwing his weight around. Since breaking into the league in 2007, Looch has averaged 200 hits per season. Not one single player on the current Bruins roster even comes close. In fact, most players on the team take more hits than they give. Over his entire career, Looch only averages 99 hits taken per season. Clearly, there is a reason why opposing players don’t go after him.
In all situation types (e.g., PK, PP, even), Lucic dominates with hits. If the Bruins employ him on the third or fourth line, he will prove to be a valuable asset against opposing top lines. In the graph below, you can see how his worst seasons still saw over 140 hits doled out. The outlying years of 2009, 2012, and 2020 were all seasons where he saw significantly less action; In 2009, he dealt with several injuries, 2012 was the shortened NHL season, and 2020 saw a reduction in games due to the pandemic. Keeping those years in mind, his career hits statistics are exceptionally impressive.

Penalties
In addition to (literally) throwing his weight around, Looch has garnered a reputation for throwing punches, too. Penalties can be a tricky business. There is a level of economics behind it; is the return on investment worth the risk of taking a penalty in the moment? Some of the most skilled, feisty players have the ability to draw as many as or even more penalties than they take.
There are also “good” penalties and “bad” penalties. “Good” penalties are those that are worth the risk, and the team can handle being on the penalty kill. “Bad” penalties are those that nearly always cost the team a goal if not more. When you look at a player’s penalty history, it’s important to look at both the number taken and drawn, as well as the kind of penalty taken (e.g., minor, major, misconduct). A player who consistently draws significant penalties is probably a red flag, especially if he doesn’t bring any other major skills to the table.
So how does Lucic compare? I thought it would be helpful to compare him to everyone’s favorite little ball of hate, Brad Marchand. Both players are 35 years old and have a reputation for their extracurriculars on the ice. Below you can see the average number of penalties taken and drawn for each grouping of seasons.
Since Looch has played for the Bruins, Kings, Oilers, and Flames, I divided the seasons into the years that he played for each team. Then I compared the average number of penalties taken and drawn by Marchy in the same time frames, despite only ever playing for the Bruins. Considering Lucic’s average number of penalties taken over the last few years has declined and the average number of penalties drawn has increased, I’d say Lucic is at low risk for creating excessive, harmful penalty-killing situations.
| Seasons | Lucic | Marchand |
|---|---|---|
| taken | drawn | taken | drawn | |
| 2007-2015* | 29 | 21 | 23 | 21 |
| 2015-2016 | 27 | 15 | 33 | 35 |
| 2016-2019 | 24 | 11 | 31 | 31 |
| 2019-2023 | 18 | 11 | 32 | 34 |
| Total average | 25 | 16 | 28 | 28 |
In terms of the breakdown of penalty types, it’s good to see that the vast majority of Lucic’s penalties continue to be minor penalties. There might be “good” and “bad” penalties mixed in there, but he isn’t putting his team in a lot of 5-minute major situations or taking many game misconducts, thus leaving his team short-handed mid-game. In the graph below, you can see he was a much feistier player in his younger days, with his total penalty count topping 40 in two seasons. It’s probably safe to say he is probably going to rack up around 20 penalties in the 2022-2023 season.

Goals
One of the easiest ways to spot if something is “off” with a player is a change in his goal-scoring rate. While some of the most elite goal-scorers continue to net high numbers into their mid-to-late-30s, many players will start to see a decline in goal-scoring around the time they turn 30. Because of that, I am a big fan of looking at goals scored and expected goals (ixG). Individual expected goals take into account the individual talent of the player. Since age 28, Lucic’s ixG count has exceeded his actual goals scored; thus, his goal scoring has fallen short of expectations. And it’s a trend that has continued since then, too. It’s certainly a disappointment to see players not meet the mark, but perhaps the quality of those goals that were scored makes up the difference.
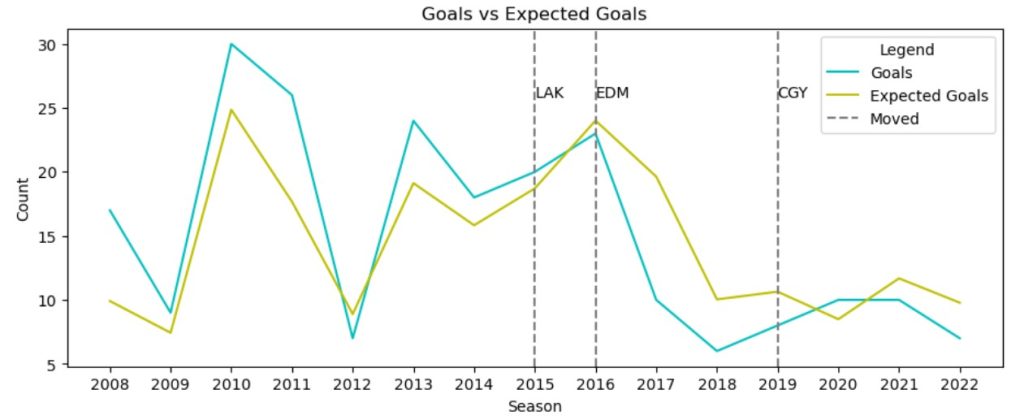
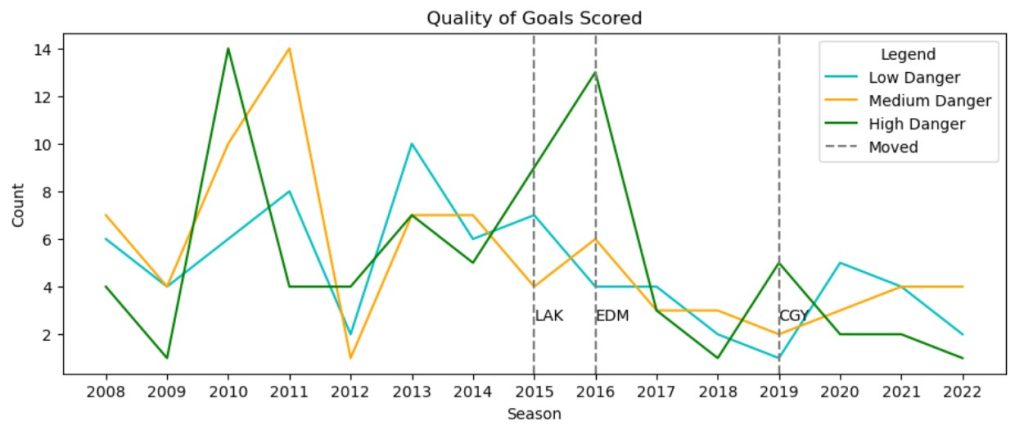
I broke down all of Lucic’s goals scored into low, medium, and high danger. As a quick refresher, the danger level of goals is based on their proximity to the net. High-danger goals are those scored in the area immediately around the crease, and low-danger goals are from the farthest away from the net. While there is a lot of fluctuation from year to year for Looch, it is a positive sign that his goals are not all low-danger goals, and he still has the ability to capitalize on opportunities in those high-danger situations.
On the Ice
Goal scoring isn’t the only way to contribute on the ice; As I have mentioned in a previous post, there are many roles to play on a team. If consistent goal-scoring isn’t part of his repertoire anymore, perhaps Lucic is contributing in other ways. Is the player able to take away pucks from opponents skillfully, or does he give away pucks a lot? And what about his individual points percentage (IPP)?
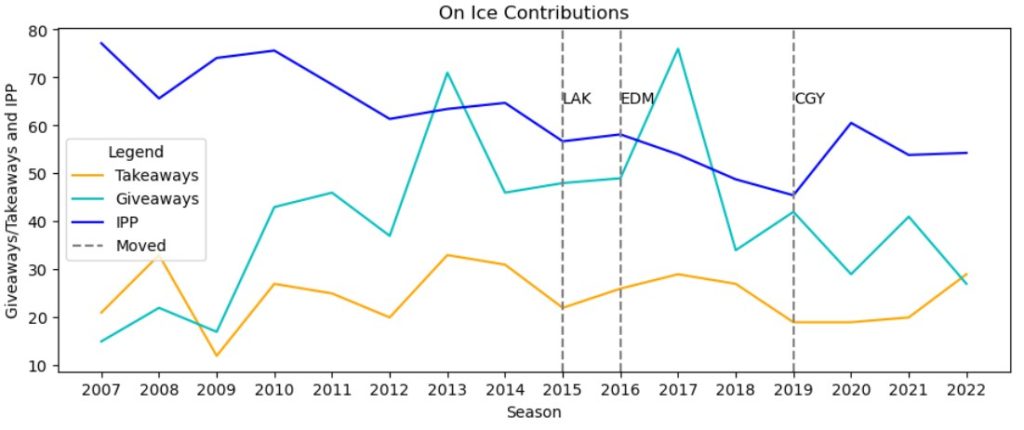
IPP is one of my favorite metrics to evaluate a player’s contributions. IPP measures the percentage of goals scored by a team in which a skater earns a point. It reflects a skater’s involvement and impact on the team’s scoring. Higher IPP indicates a greater contribution to the team’s overall success. Not surprisingly, in the 2022-2023 season, Connor McDavid’s IPP of 80.53 was the highest in the league.
In the graph below, the vertical y-axis represents both the count of Looch’s takeaways/giveaways and the percentage from his IPP. While there might not necessarily be a direct or causal relationship between takeaways/giveaways and IPP, it is interesting to see how they coexist. Rule number one in stats class: correlation does not equal causation. Looch has always been one to giveaway pucks more frequently than he takes them away. However, it does appear that he is showing some overall improvement on the ice in recent years. Plus, he still has quite a high IPP of about 60.
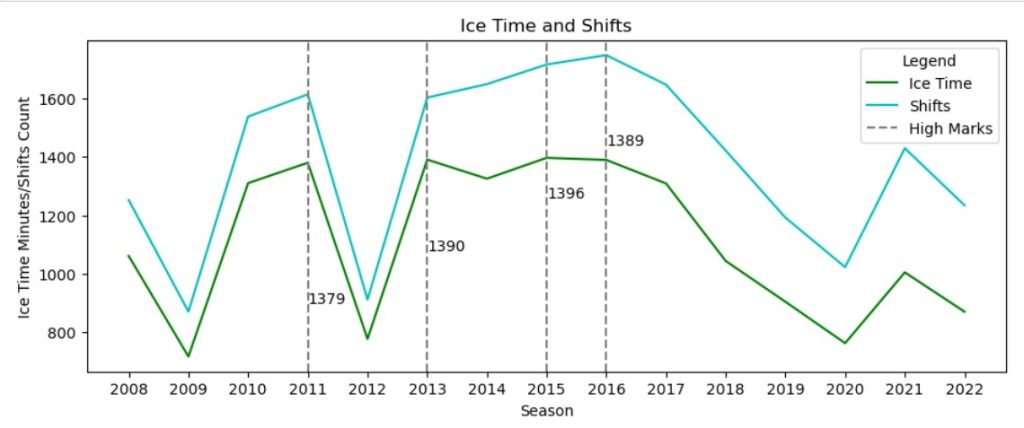
And what about ice time in general? What kind of minutes is he racking up in each game? Again, some of the very best players continue to put in tough, heavy minutes. Patrice Bergeron is 38 years old and has played an average of 17 minutes per game and 23-25 shifts per game the last two seasons. As a player gets older, he may transition from fewer, longer shifts to more frequent, shorter shifts. This doesn’t necessarily reflect poorly on the player. Instead, it could be a coaching strategy of “load management” for an older body to help him stay healthy and have the energy to last deep into playoffs. Or perhaps the player can only maintain his high level of play for shorter periods of time, and so the coaching staff is maximizing his impact.
In the graph below, I have both the total time on ice in minutes and the count of shifts per season. Just like in the hits graph above, you can see the outliers from 2009, 2012, and 2020 pulling his numbers down. Ignoring those years, Lucic has shown a fairly standard bell curve of his ice time and shift count as he has aged. The dashed reference lines identify some of his highest TOI seasons. I think it is really interesting that he had massive minutes and a large shift count in 2016. That season must have really taken a toll on his body! Another interesting phenomenon happens in 2016 into 2017; he begins to transition into more frequent, shorter shifts.
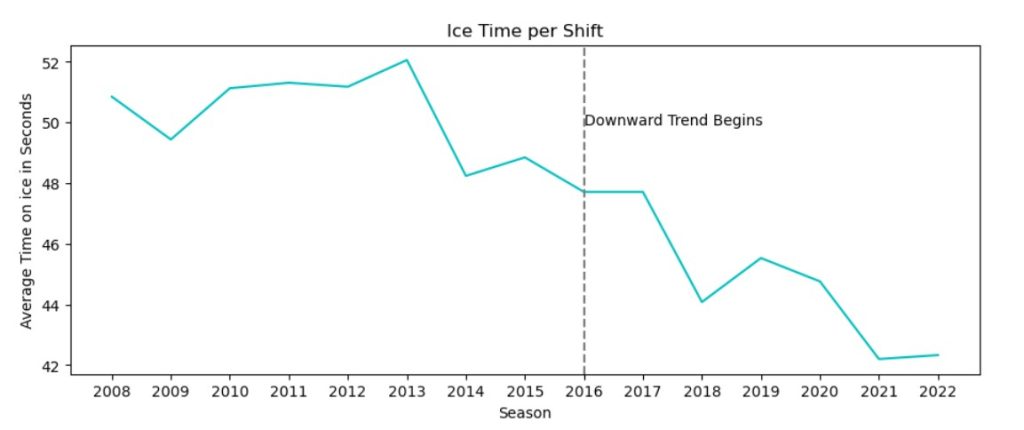
In the final graph, you can see how long Looch’s shifts have been over his career. For context, hockey players are typically out on the ice for about 45-60 seconds. For the majority of his career, Lucic’s shifts were what I would consider on the higher side of average. But by 2017, his average shift length starts to decline quite sharply. Based on this, I would presume Lucic will find himself on the third or fourth line.
All in all, I’d say that Lucic will prove to be well worth the million dollars. And the fact that he is “coming home” will make the season all the more fun to watch. I am looking forward to checking in on him through the season to see if my broad predictions of penalties, ice time, hits, and location on the roster come to fruition.


Leave a Reply