By Karoline Sears | Follow me on Mastodon: @spelled_with_a_k and Substack
It’s the end of the school year, and I’m handing out report cards ahead of the free agency to see how some Boston Bruins pending free agents performed over the course of the last season. I think we all knew halfway through the 2022-2023 season that a good number of Bruins players were positioning themselves very nicely for a sizable pay raise come July 1st. I’m focusing on three specific players: Jeremy Swayman (RFA), Connor Clifton (UFA), Trent Frederic (RFA). While there are more than three pending free agents, I chose to start with Swayman, Cliffton, and Frederic for a number of reasons.
First, each player represents a different position on the ice. This is an important element to note because different positions can have different values on teams. Every player on a team has a role. Some players are the goal-scorers, some are defensively-minded, and others specifically exist to kill penalties or are the grinders on the team. It’s important to consider these roles when interpreting the data.
Second, I chose Sway, Cliffy, and Freddy for somewhat sentimental reasons. All of them have been with the Bruins for their entire careers, and we’ve watched them “grow up” out there on the ice. They’ve all shown their incredible potential and vast improvement over the last few years.
Finally, I wanted to look at players who could likely return in the fall and have also been entrenched in the Boston culture. That’s why I didn’t choose a player like David Krejči (possible retirement) or Tyler Bertuzzi (acquired at the trade deadline). While there are many statistics you can use to praise or condemn any player, I’ve settled on seven per player to make my evaluation.
The Assignments
The first four metrics are applied to all three players, with some minor adjustments due to position. These stats allow us to determine their value specifically to the Boston Bruins; if Don Sweeney had to pick only one of the three players, which player might provide the best outcome?
The remaining three metrics are position-specific. These numbers give us context to the player’s overall value within the position and, ultimately, the potential value of their next contract. Think of these stats as grades for their gen-ed requirements and then grades for their electives.
The metrics used for everyone:
- Game Score (GS)
- Originally developed by Dom Luszczyszyn in 2016 and updated in 2019, this metric is designed to measure single-game productivity. It takes into account goals, assists, points, expected points, blocks, PIMs, and usage, each weighted to the player’s position on the ice. This number is represented as an average over the course of a season. For context, in 2022-2023 Connor McDavid’s average GS was 1.97, and David Pastrňák’s was 1.55.
- Wins Above Replacement (WAR)
- Sometimes also known as Goals Above Replacement, this is another metric designed to assign a single number to quantify the value of a player’s contributions to the team. For context, in 2022-2023, McDavid also had the highest WAR score of 5.4.
- Expected X
- Individual Expected Goals Differential (ixG diff): for skaters, ixG is a quantitative measure of the quality of the scoring chances and goal-scoring abilities specific to that player. Comparing this number to the actual number of goals scored demonstrates if the player was able to meet or exceed expectations – that is what I am calling ixG diff. I am rating players as “meets expectations” when their ixG diff falls between -1 and 1.
- Goals Saved Above Expected (GSAx): for goalies, GSAx compares a goalie’s performance to the expected goals based on the quality and quantity of shots faced. It quantifies the number of goals a goalie has prevented or allowed compared to what was anticipated. Positive GSAx values indicate above-average goaltending.
- High Danger X
- High Danger Goals For Percent (HDGF%): for skaters, HDGF% measures the percent of High Danger Goals scored by the player’s team, while that player is on the ice. High Danger Goals are goals scored from the area immediately surrounding the crease. The higher the percentage, the higher the value of the player.
- High Danger Save Percentage (HDSV%): For goalies, HDSV% measures a goalie’s ability to stop shots from High Danger scoring areas (i.e., around the crease). The higher the value, the more skilled the goalie.
For the skaters:
- Individual Points Percentage (IPP)
- IPP measures the percentage of goals scored by a team in which a skater earns a point. It reflects a skater’s involvement and impact on the team’s scoring. Higher IPP indicates a greater contribution to the team’s overall success. Not surprisingly, in the 2022-2023 season, Connor McDavid’s IPP of 80.53 was the highest in the league.
- Defensive Point Shares (DPS)
- DPS estimates the number of points a player contributes to their team’s success through defensive play. It considers ice time, plus/minus, penalty-killing performance, and defensive zone starts. Higher DPS values indicate strong defensive contributions. Hampus Lindholm lead the league in DPS in 2022-2023 with 7.2.
- Player Usage (PU)
- This is another statistic developed by Dom Luszczyszyn in which he calculated players’ Time on Ice (TOI) as a percentile, comparing the player to his teammates and opponents. It’s one way to demonstrate a team’s reliance on a particular player. I’ve put together a relatively simple, unweighted percentile rank to demonstrate player usage.
- The percentiles are designed to rank the player in four ways:
- Quality of Teammate D: How this player ranks among the defense on his team
- Quality of Teammate F: How this player ranks among the forwards on his team
- Quality of Competition D: How this player ranks among the defense on all opposing teams
- Quality of Competition F: how this player ranks among the forwards on all opposing teams
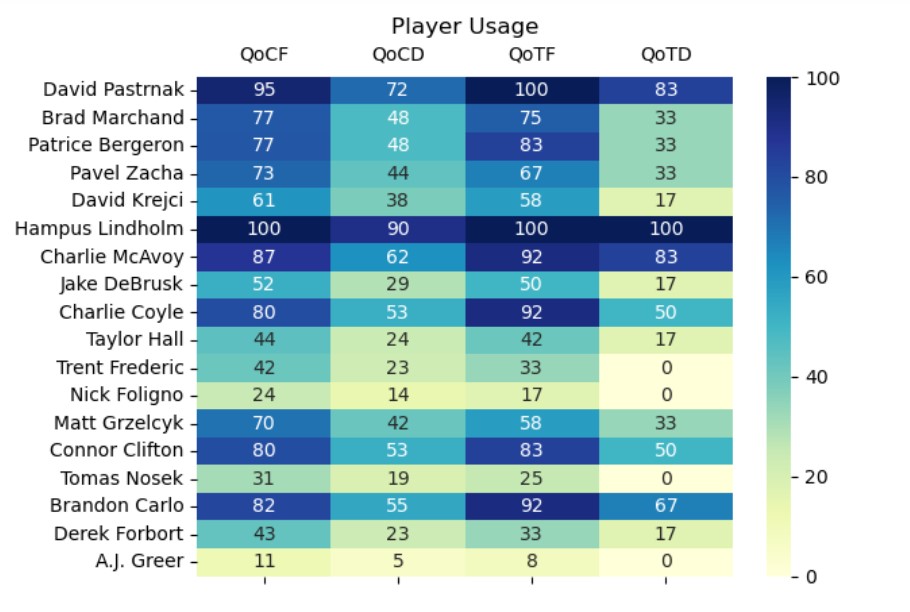
Remember: a percentile is different from a percentage. Percentiles divide a dataset into 100 equal parts, with each part representing 1% of the data. In the above table, for example, Hampus Lindholm’s TOI is in the 100th percentile for QoTD. That means his TOI is greater than all of his other defensive teammates. Charlie Coyle’s QoTF TOI is in the 92nd percentile, meaning his TOI is greater than 92% of the remaining forwards on his team.
For the goalie:
- Goals Saved Above Average (GSAA)
- Quality Start Percentage (QS%)
- Developed by Ron Vollman, QS% evaluates a goalie’s ability to deliver consistently solid performances. A Quality Start (QS) is defined as a game where the goalie achieves a save percentage equal to or higher than the league average save percentage. QS% is the percent of a goalie’s starts deemed a QS. Of all the goaltenders to play more than half the 2022-2023 season, Linus Ullmark led the way with a QS% of 0.896 – almost 90% of his starts were QS!
- Delta (Fenwick) Save Percentage (ΔSV%)
- This measures a goalie’s performance relative to the average save percentage of all goalies facing the same opponents. Fenwick shot attempts are all unblocked attempts. This metric indicates how well a goalie performs relative to the average. Of all goalies to start more than half of the season in 2022-2023, Ilya Sorokin holds the top stat with 1.97%.
Final Notes Before Grading
For Clifton and Frederic, I evaluated the “skater” stats a little differently depending on the players’ position. For example, while any forward-skating player can have defensive capabilities (hello, Patrice Bergeron), I expect a defenseman, such as Connor Clifton, to have excellent DPS stats.
Over the last decade, several different hockey stats pages have developed different ways to crunch the numbers. For example, Evolving-Hockey.com calculated Swayman’s GSAx as 20.99, but MoneyPuck.com has his GSAx as 24. One isn’t necessarily “right” and the other “wrong”; rather, it is indicative that different data scientists may adjust their calculations differently based on the aspects of the game they perceive to be more important. As a result, I’ve pulled these metrics from as few sources as possible to maintain consistent results. I have indicated the source of each metric for each player below.
The final grades I hand out are also qualitative in nature at this point. I’d like to develop a more quantitative method for assigning final grades in the future. I am evaluating these players as individuals first and as players in the National Hockey League second. This means I am taking into account their individual progress first and then how they performed relative to the league.
Each report card has the metric named, the player’s score, and notes. Notes indicate how that metric has changed from the 2021-2022 season to the 2022-2023 season. These range from significantly improved (SI), improved (I), maintained (M), declined (D), significantly declined (SD), exceeded expectations (EE), met expectations (ME), fails expectations (FE), above average (AA), average (A), below average (BA).
| Grade | Requirements | |
| A+ | Three or more SI, EE, or AA in any combination. The player also shows consistent growth/improvement over the course of his career OR is a league leader in one or more metrics. | |
| A | Three or more SI, EE, or AA in any combination. The player also shows consistent growth/improvement over the course of his career OR is a league leader in one or more metrics. | |
| A- | Two or more I and only one SI, EE, or AA in any combination. The player also shows consistent growth/improvement over the course of his career OR is often in the upper ranks in one or more metrics. | |
| B + | Two or more I, ME, or A in any combination. The player has posted good numbers, but might not have the consistency in his career (yet). | |
| B | Three or more M, ME, or A and at least one D in any combination, without any A-level metrics. |
Jeremy Swayman
Swayman is coming to the end of his entry-level contract, which he signed in March 2020. Based on his 2022-2023 stats and the continued growth and improvement in his game, he is particularly well-situated for a pay raise this summer. The question is, will he find himself as a franchise goalie with the Boston Bruins or as a valuable trade chip for the team in the 2023-2024 season?
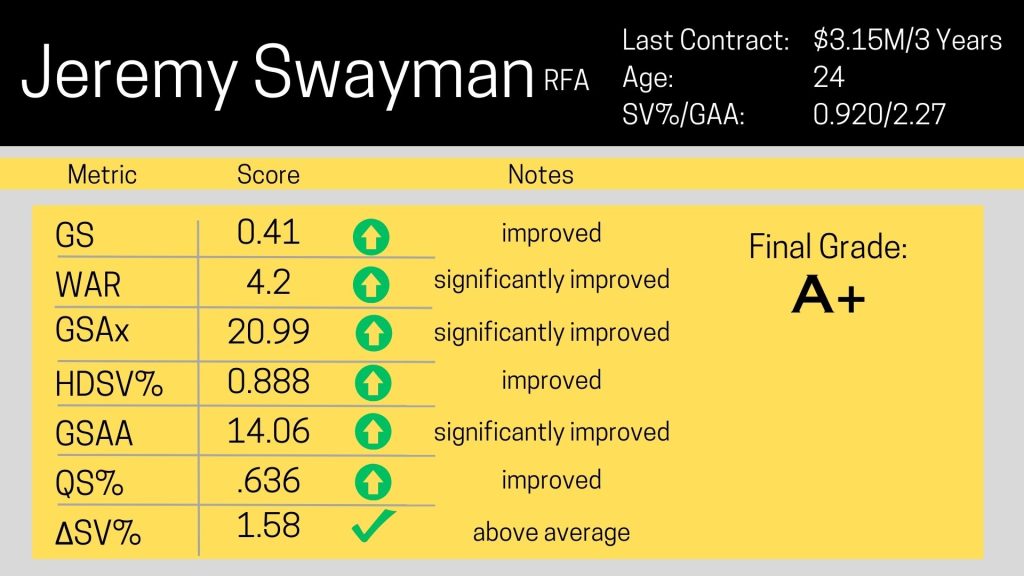
As you can see, based on my rubric, Swayman earned an A+ for multiple SI metrics, as well as an AA metric. He also won the Jennings trophy with goalie partner Linus Ullmark, thus making him a league leader.
Sources:
GS: HockeyStatCards.com
WAR: Evolving-Hockey.com
GSAx: Evolving-Hockey.com
HDSV%: Hockey-Reference.com
GSAA: Evolving-Hockey.com
QS%: Hockey-Reference.com
ΔSV%: Evolving-Hockey.com
Connor Clifton
This is Clifton’s first time as an Unrestricted Free Agent. He thrived in Coach Montgomery’s system, improving in nearly every category. Cliffy falls just short of an A, but it does not diminish his high value. Considering that he plays on a team with two of the most heavily used players in the entire league (Lindholm and McAvoy), Cliffy is used an average amount of time. It would not have surprised me to discover a much lower PU percentile as a result. Like Swayman, Clifton is in a good position to receive a raise; the question is, will he test the market to find a team where he can get more minutes with that new paycheck or stay in Boston?
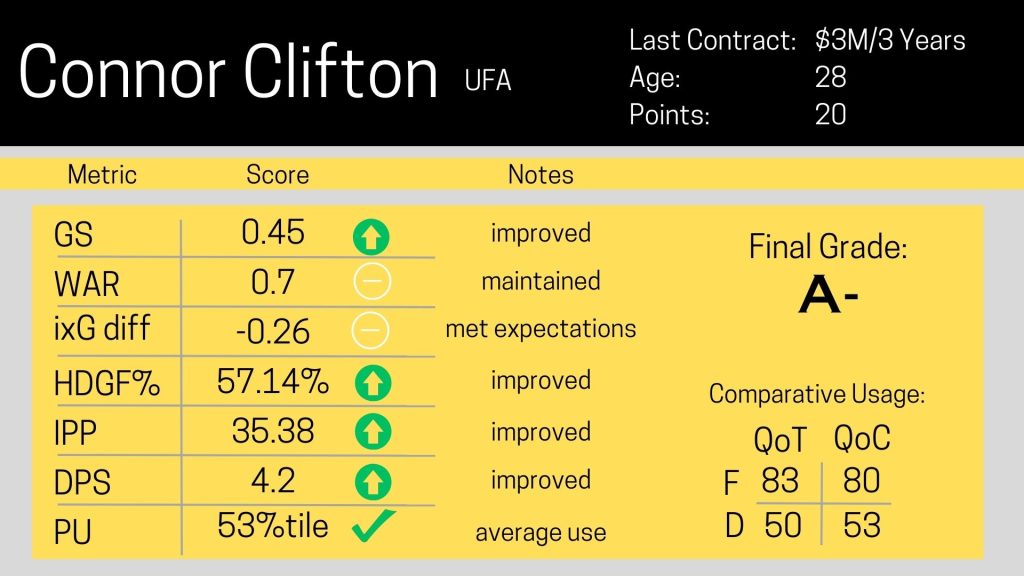
Clifton’s multiple improved notes and high metrics place him solidly in A-level territory. His only detraction comes from the two maintained/met expectations notes for WAR and ixG diff. In Cliffy’s case, he is entering the prime of his career, and I hope to see continued improvement next season to push him up the grading rubric.
Sources
GS: HockeyStatCards.com
WAR: Evolving-Hockey.com
ixG Diff: Hockey-Reference.com
HDGF%: NaturalStatTrick.com
IPP: NaturalStatTrick.com
DPS: Hockey-Reference.com
PU: MoneyPuck.com
Trent Frederic
Freddy showed some significant growth in a number of key areas but also fell short and actually declined slightly in his contributions to the team. As a Restricted Free Agent, Frederic is looking for a contract extension to bring him into the prime of his career. Much has been said about his potential, and just like Clifton, Frederic has thrived under Coach Montgomery.
I was disappointed to discover a lower IPP in the 2022-2023 season compared to the previous two seasons. His IPP score has actually declined over the last three seasons, yet his ixG and the difference between his ixG and G has exceeded expectations. As older players begin to retire, the question in Freddy’s case is, will he be able to grow and rise to the level of a consistent middle or top-six forward?
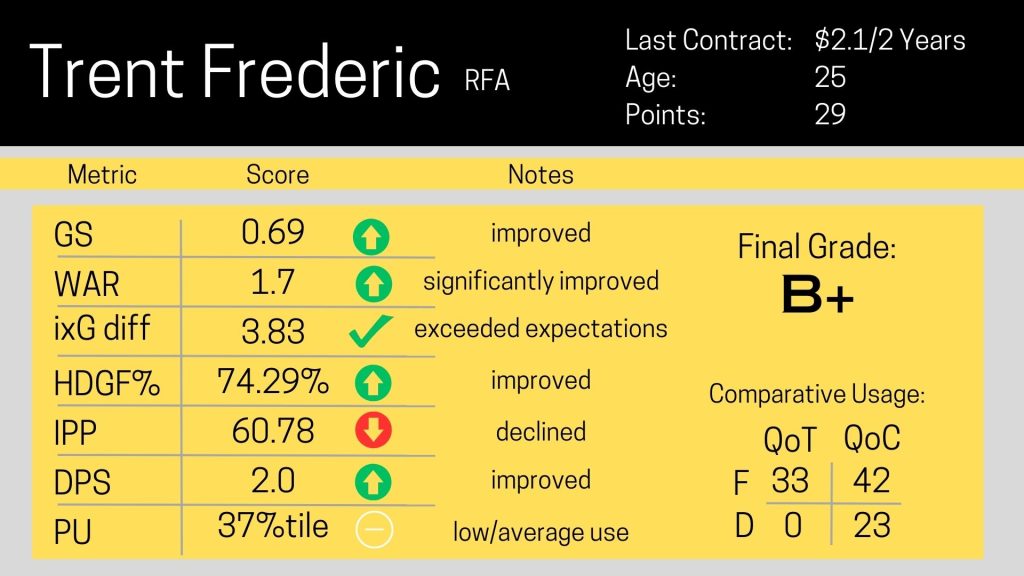
Frederic really knocked it out of the part this year in his ixG diff by scoring a lot more goals than was expected. If he wants to take it to the next level, he is going to have to show some more consistent performance and turn the trend of his IPP around. That single D is what pushed Freddy down to a B+ despite one SI and one EE.
Sources:
GS: HockeyStatCards.com
WAR: Evolving-Hockey.com
ixG Diff: Hockey-Reference.com
HDGF%: NaturalStatTrick.com
IPP: NaturalStatTrick.com
DPS: Hockey-Reference.com
PU: MoneyPuck.com
What comes next?
As I continue to tweak my rubric and add some more nuance to the metrics in these report cards, I’ll release more cards for more players. You might notice that I didn’t say who should stay or who should go. I’ll leave that up to you, the reader, to make your own arguments. The free agency kicks off in a few days, so until then, I will be waiting with bated breath to see what happens next.


Leave a Reply