
By Karoline Sears | Follow me on Mastodon: @spelled_with_a_k and Substack
Hindsight is 20/20 and I think it’s safe to say that Don Sweeny was specifically looking to add veterans to the lineup as a way to transition the Boston Bruins from their most recent golden age (2006-2025) into the next. I’ll get into why I think the current golden age of the Bruins is coming to a close in a future post.
For now, it looks like the addition of three veteran players with lengthy resumes for little cash is a prudent approach. Lucic is bringing his personality and power-forward skills, van Riemsdyk is bringing his consistency in play, and now we will take a look at what our third veteran, Kevin Shattenkirk, has to bring.
Journeyman
Depending on your take, the term journeyman can be positive or negative; some use it to describe a player who is technically competent but is unable to excel. In kinder words, a journeyman is someone who never really settles into one or two teams but knows his trade inside out. The Boston Bruins will be Shattenkirk’s seventh team over the course of his 13-year career.
What Does He Bring?
As I looked over Shattenkirk’s playing history, it reminded me of another player who has a ton of talent, was drafted high, and yet has never been able to stay anywhere very long: Taylor Hall. If you’ve read any of my other posts, you will know that I tend to stay focused on the Bruins during the season and I only take a cursory glance at the rest of the league. Taking a deep dive into Shattenkirk’s history took me by surprise. A Stanley Cup, an All-Star Game, Second Team All American, and a U-18 silver medalist. Looking at that resume, I would absolutely call him a journeyman in the most respectful way; the man knows the game.
The Stats
So we know Shattenkirk’s history and accolades, but what about his actual stats? In my initial, quick overview of his numbers, I didn’t see anything particularly outstanding, so I decided to focus on two stats that might best clarify the picture: Player Usage and Defensive Point Shares (“DPS”).
Player Usage
Player usage was developed as a way to determine how “tough” the minutes a player faced out on the ice over the course of a season. Is that player out there 28 minutes per game because the rest of his defensive core is terrible? How does this player’s time on ice stack up against the high minutes of the best defensemen in the league? What kind of competition is the player really up against when he is out on the ice?
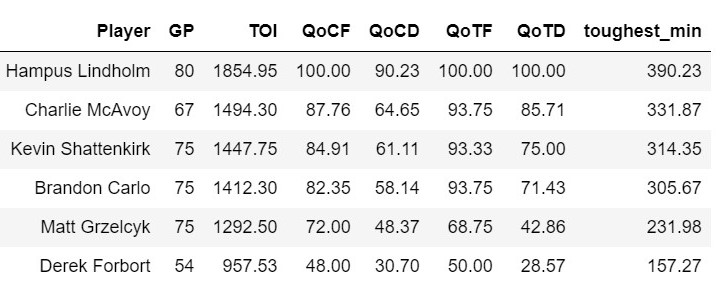
Looking at the defensive core for this coming season’s Boston Bruins, Shattenkirk falls right in the middle for “tough” minutes. And if you think about it, Hampus Lindholm and Charlie McAvoy are in a class all of their own when it comes to time on ice, so that makes Shattenkirk look even better on paper.
What are “Tough” Minutes?
“Tough” minutes are calculated by adding up the Quality of Competition Forwards/Defensemen (QoC) and the Quality of Team Forwards/Defensemen (QoT). All of these statistics are based on Time on Ice (TOI). For the purposes of this analysis, I am going to skip the use of tough minutes, since I am more interested in comparing Shattenkirk to other defensive players. Comparing like with like is very important in analytics, so I only looked at QoCD and QoTD. When you compare apples to apples, you can get a clearer idea of where the player falls relative to all other players in the league and on the team in that role.
I also adjusted my model to account for players across the league who were moved during the season. Those QoC percentiles were weighted based on the TOI played for each team. I felt that this was an important adjustment to make because where they play, how they are used, and the quality of competition can change from one team to another.
Quality of Competition vs. Quality of Team
As a refresher, a percentile is a way to understand where a particular value stands in relation to a group of values. Imagine you have a list of numbers that represent test scores for a class of students. If your score is in the 80th percentile, it means that you scored higher than 80% of the students in the class.
In QoC, we are comparing the player to all other players not on his team. QoT is the rank of the player compared to his own teammates. For example, Charlie McAvoy was in the ~85th percentile among defensemen on the Boston Bruins last season. However, compared to all other defensive players, he was on the ice more than 64% of all defensemen in the league.
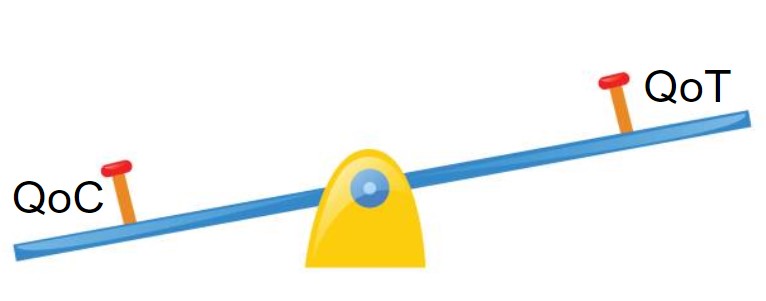
Player Usage Seesaw
If Player Usage is a new statistic to you, I’ll run though a brief explainer of how to decode the nuance of this calculation. The number of total values being considered in QoT and QoC is extremely different. There are fewer comparisons to make on a team than across the league. That’s why we use percentages and percentiles when comparing two different datasets, such as these.
For this statistic, imagine a seesaw: in one seat you have QoT and QoC in the other. The first step in understanding the Player Usage analysis is to ask if the seesaw is balanced. If it isn’t, the next step is to ask “why?”. If it is, the next step is to ask “how?”.
Unbalanced
On a team, it is not very difficult for a defenseman to fall into the 100th percentile for TOI, since there are so few players to rank among. If they are in the 100th percentile on their team, but below the 75th percentile among their peers, then something weird is going on. Take a look at Nick Jensen, Justin Holl, and David Savard below:
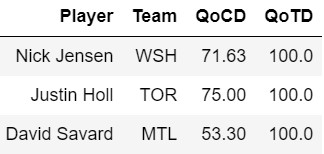
Percentile rankings such as those for Jensen, Holl, and Savard make me question what on earth is happening on those three teams. How many defensemen played on the team last year!? The seesaw can be tipped in the other direction, but it’s not quite as dramatic as the example above. If a player’s QoT is lower than their QoC, they must play a lot, but it means their teammates play even more.
Balanced
If the percentile rank for a player is fairly balanced between the QoC and QoT, then the next step is to determine how they are balanced. Is the player in the bottom 30th percentile in both stats? They probably aren’t getting many minutes (and probably for a reason!). Are both stats somewhat middle of the road? That’s probably your “ol’ reliable”.
Or is the player in the 100th percentile in both stats? Take Erik Karlsson, for example. As you can see below, he was the top minute-getter on his defensive core last season. It’s also no surprise that he had the most time on ice compared to his entire team since defensive players play more minutes. But he was also in the 99th percentile among all defensemen (QoCD). This tells me that not only was he the most used defenseman on the team, but he was used a lot for a defenseman, period.
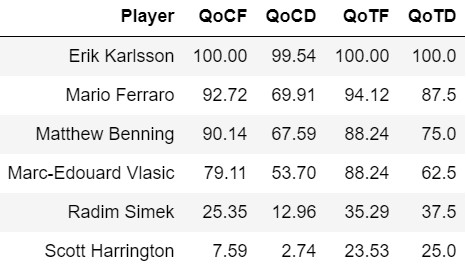
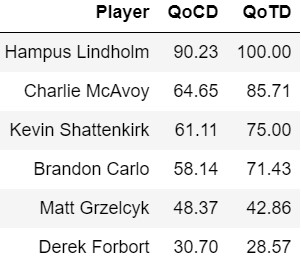
On the Bruins, Lindholm played the most minutes last year and he was in the 90th percentile for all defensemen. That’s a lot, but not nearly as high as Karlsson. The fact that Shattenkirk falls in nearly identical percentiles in QoC and QoT means to me that he was used on the ice at a comparable rate both on the team and in the league. I would be more concerned if he landed in the 80th or 90th percentiles in QoT but the 50th percentile in QoC. Stats like that would lead me to believe there were probably a lot more than six or seven defensive players earning regular minutes on his team or his time was being mismanaged.
Now you can call yourself an expert in Player Usage and see this table again and have a better understanding of Shattenkirk and which pairing he might fall into and how much ice time he is apt to receive.
Defensive Point Shares
Defensive Point Shares (DPS) is an estimate of the number of points contributed by a player due to his defense. While all players (even goalies!) can have a DPS score, it is a key stat for defensemen and defensive forwards. Last season, the average DPS score for all players was 1.13, with defensemen earning an average of 2.02 and forwards earning an average of 0.73 DPS.
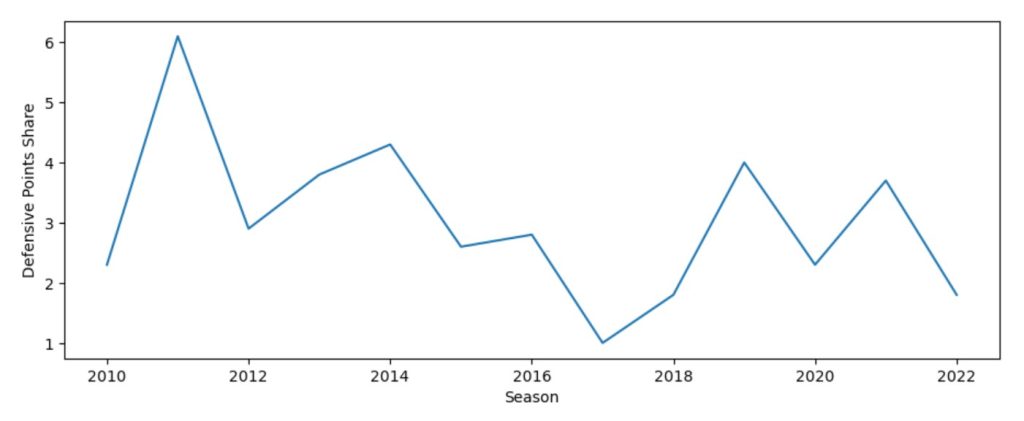
Throughout 13 seasons, Shattenkirk has had an average of 3.04 DPS score. Granted, it’s never been particularly outstanding among defensemen, but he has been at or above last season’s average (2.02) nearly every season. The graph above tells me that he has the potential to contribute significantly and consistently because he has had some very good seasons in the past. He is also joining a team that boasted three defensemen in the top ten for DPS: Lindholm (first), Carlo (sixth), and Grzelcyk (seventh). I hope to see him rise to the occasion.
What to Look For?
Shattenkirk is a tough one to decode on paper. I will be optimistic on this one and assume that Sweeney saw enough positive attributes in the various qualities that make up a good defenseman. Who knows, he might be the new Uncle Nick and has been hired for his leadership more than anything else. Let’s hope he has a better freshman season in Boston than Fliggy did.


Leave a Reply