
By Karoline Sears | Follow me on Mastodon: @spelled_with_a_k and Substack
Welcome to your monthly Bruins Stats Corner stats tracker round-up. Each month I will update this post so we can track how well this centennial team is fairing. I have chosen some of my favorite stats to track: Defensive Points Share (DPS), Faceoff Wins Percentage (FOW%), Time on Ice (TOI), and Individual Points Percentage (IPP). Besides being my favorites, these were stats that Patrice Bergeron was king of and this is a good way to see how he is missed and how the Boston Bruins are coping without him.
It’s mid-November and we are an eighth of the way through the season. I am including October’s stats just as a point of comparison.
Defensive Points Share
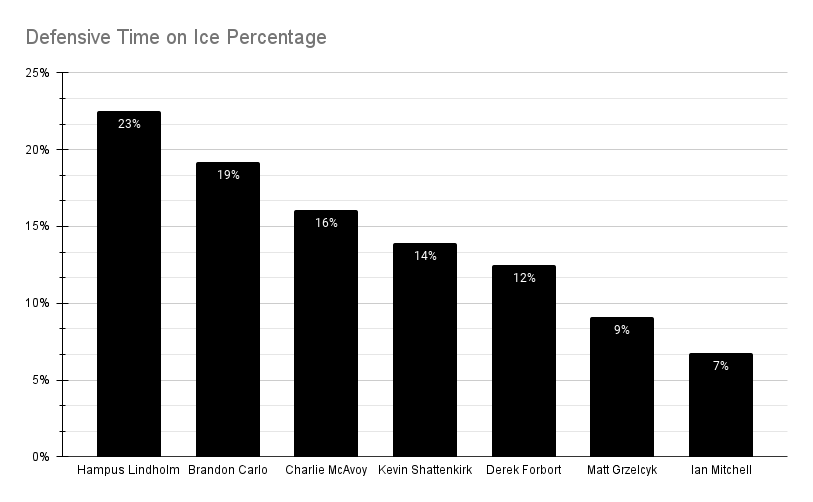
DPS estimates the number of points a player contributes to their team’s success through defensive play. It considers ice time, plus/minus, penalty-killing performance, and defensive zone starts. Higher DPS values indicate strong defensive contributions. Hampus Lindholm led the league in DPS in 2022-2023 with 7.2.
It typically takes into account various defensive statistics, such as:
- Blocked Shots: The number of shots a player blocks to prevent them from reaching the net.
- Hits: The number of body checks or hits a player delivers, which can disrupt the opponent’s offensive plays.
- Takeaways: The number of times a player successfully takes the puck away from an opponent.
- Defensive Zone Starts: The percentage of a player’s shifts that begin in the defensive zone, which can indicate a player’s defensive responsibilities.
- Penalty Killing Time: The amount of time a player spends on the penalty kill, which is a crucial defensive role.
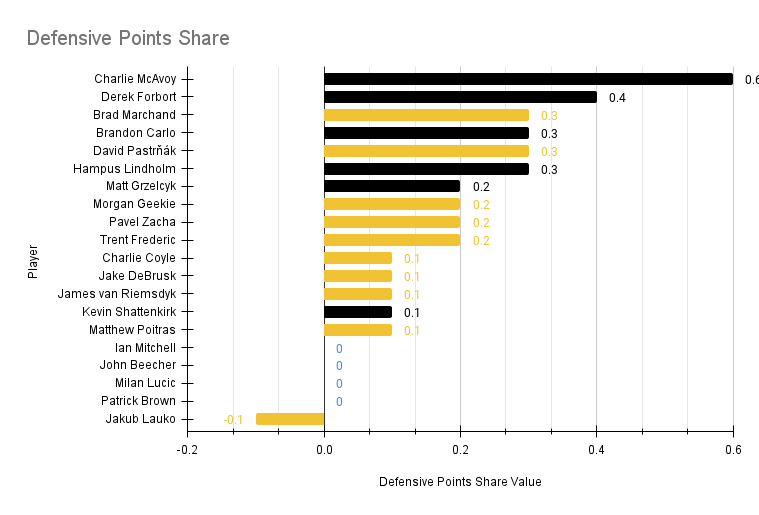
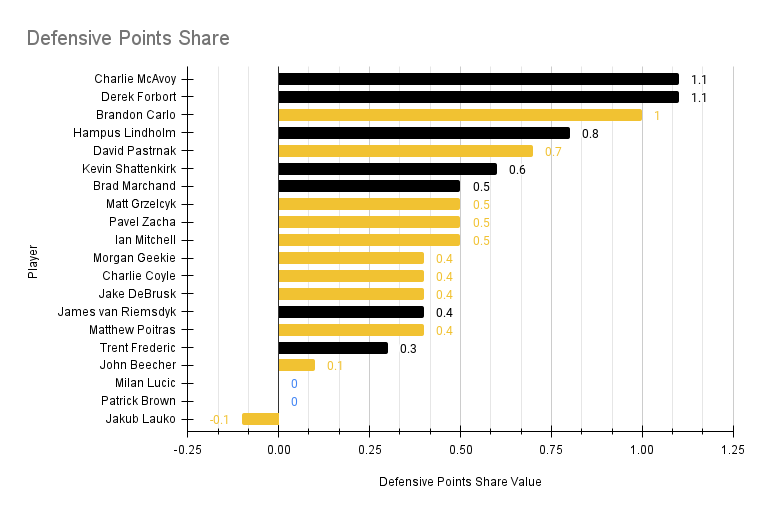
You’ve probably heard a lot about Brandon Carlo these days; he’s playing the best hockey of his career. He is a “defensive-defenseman” and his DPS really shows just how much impact he has on the ice in keeping pucks out of the defensive zone. In less than a month, Carlo has gone from a 0.3 DPS to a 1.0 DPS score, almost matching Charlie McAvoy and Derek Forbort. And speaking of Forbort, it’s no wonder his score has also jumped. After missing some time recovering from a pre-season injury, he has been throwing himself at pucks left and right.
Faceoff Win Percentage
Considering the Bruins are without the king of faceoffs this season, the centers are holding their own right now. In fact, we’ve seen a noticeable improvement in Charlie Coyle’s performance at the faceoff dot. Not only has his win percentage jumped 12 points, but his total faceoffs count is 251.
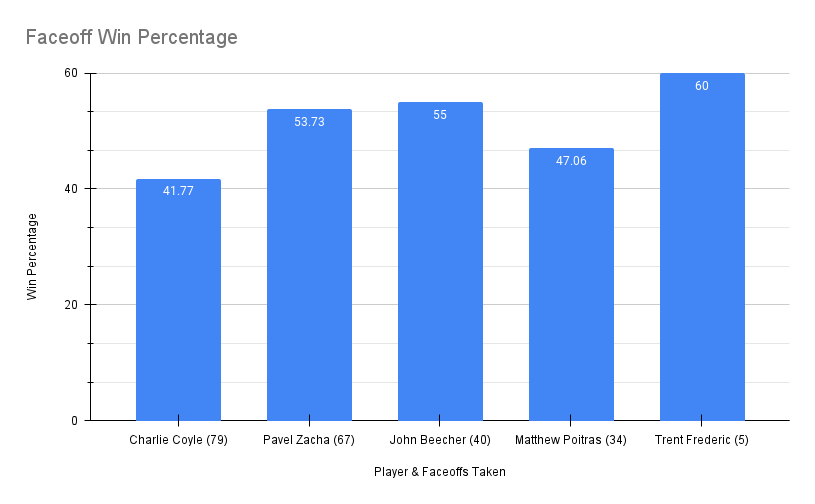
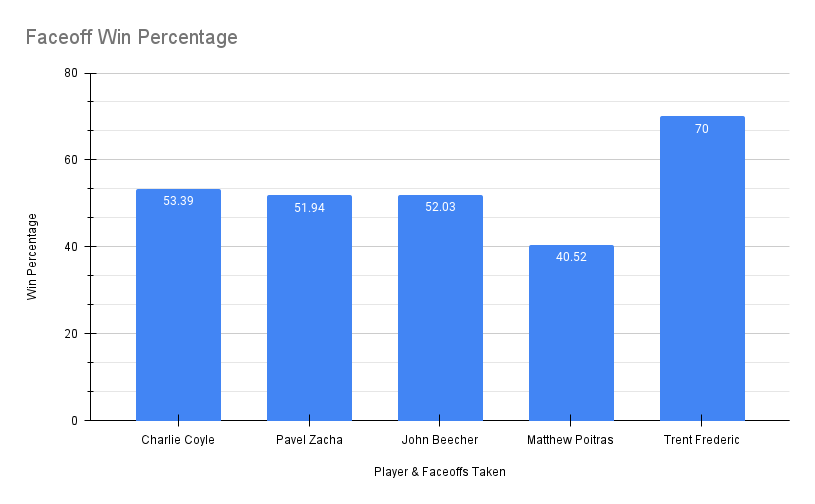
Coyle, Pavel Zacha (206 faceoffs), and John Beecher (123 faceoffs) are doing a very good and consistent job of winning faceoffs. I think we can and should be pretty pleased with where our centers are. Matthew Poitras has faced off 116 times and still has some things to learn. Trent Frederic has only taken 10 faceoffs to date, so keep in mind his 70% is not a great reflection of his average skillset.
Time on Ice
I’ve split up the TOI tracker between forwards and defencemen for the time being; If you’ve read some of my other posts, you know that I like to look at player usage, and that means blending both types of skating players’ stats. Since it is so early and the season, I’m keeping things simple. Especially as rosters are still being tweaked across the league.
Obviously, the upper-body injury sustained by Matt Grzelcyk and the four-game suspension by McAvoy have impacted their total minutes. You can see how much Jim Montgomery depended on Hampus Lindholm and Brandon Carlo during those games.
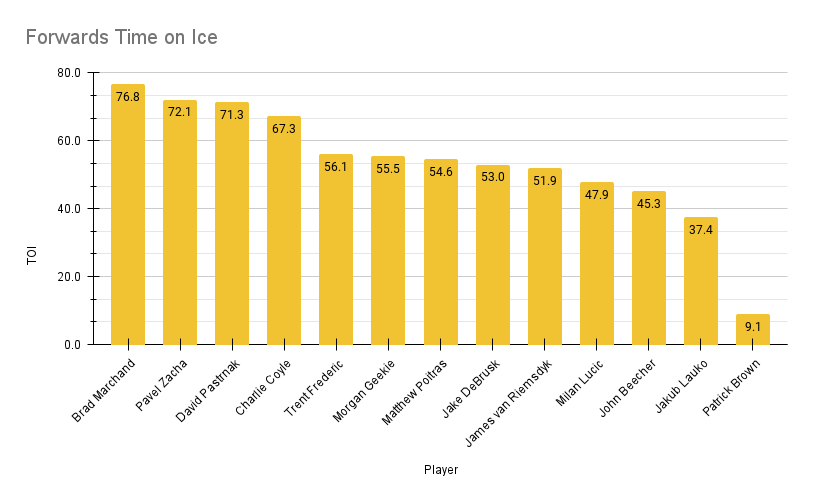
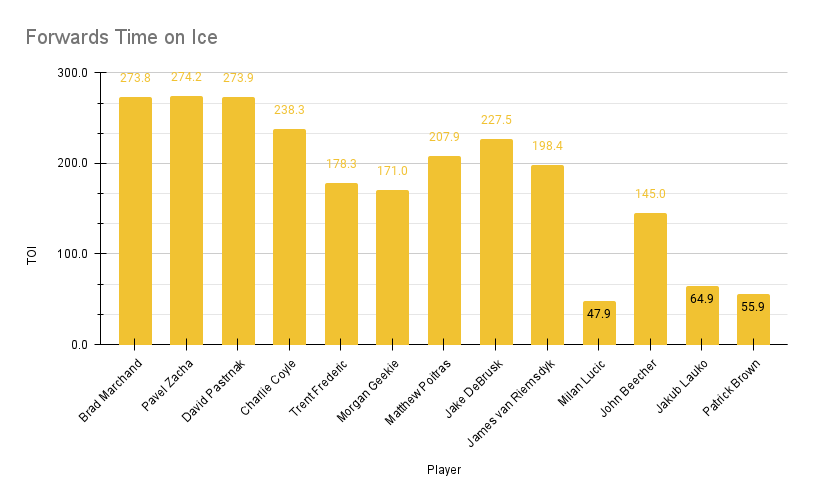
Last month, Brad Marchand led the way with time on ice. In November, he continues to be a team leader, but we’ve seen some increase in time for both Pavel Zacha and David Pastrnak.
Individual Points Percentage
When it comes to offensive contribution, the IPP is also in the family of Points Shares statistics. When a player is on the ice, how often is he directly contributing to goals for his team – or even against? While it is still quite early, the stats are telling. Most of these 100s will start moving back down to the mean (~63% for forwards and ~38% for defencemen), but considering how the third and fourth lines have been really connecting well on the ice, it is no wonder that players from those lines are contributing the most right now.
A “0.0” above a player indicates that he has been on the ice for goals, but did not earn a point from the goal. If a player is missing, that means they have yet to be on the ice for a goal at all.
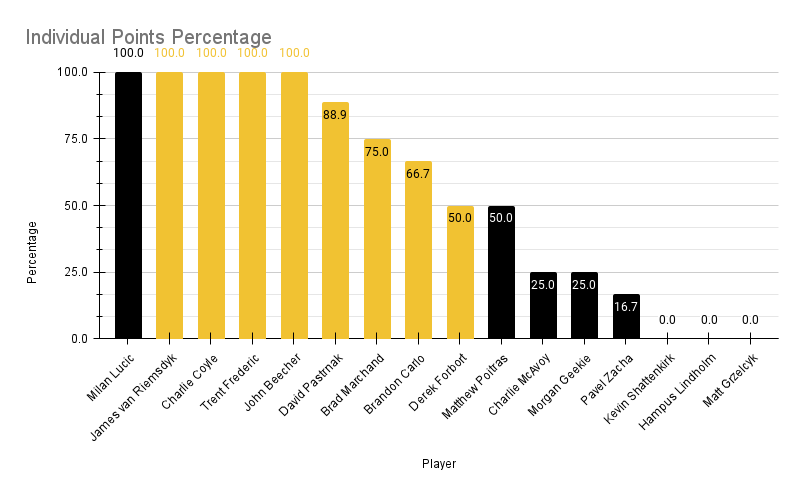
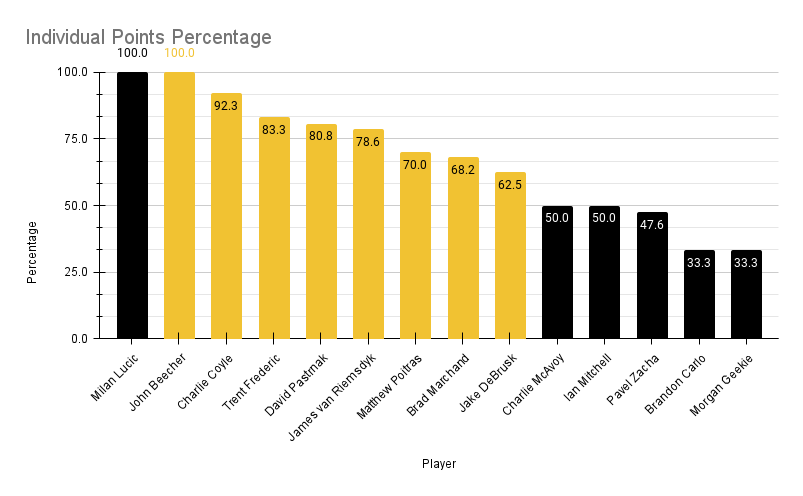
You may notice in the November chart that Milan Lucic has a 100 IPP; that’s because he had that number before being placed on the LTIR after the California road trip. I think it’s really interesting to see how John Beecher has stayed at the top of the team IPP rankings.


Leave a Reply