
By Karoline Sears | Follow me on Mastodon: @spelled_with_a_k and Substack
The pre-season is over and it’s time to make some decisions. Most of the young players we saw over the past few weeks will return to minor league play to continue their development. Others were surprising standouts that showed us all that they are, in fact, ready to don that historic sweater on October 11th.
While the pre-season is too small of a sample size of data to draw any accurate predictive conclusions about our old favorites and newcomers, it can be a place to start. I advise you to take these numbers with a grain of salt, especially for our guaranteed roster spot men, like David Pastrňák or Hampus Lindholm. The numbers for perceived standouts Matthew Poitras, John Beecher, Mason Lohrei, and others tell us that our gut feelings about these young guys were pretty spot on. I grabbed these stats from NaturalStatTrick.com.
As the season progresses, I plan to publish a weekly update on my favorite metrics so we can track them together. For the Corsi For Percentage (CF%) and goal-scoring expectations visuals, I only took players who participated in at least 3 pre-season games.
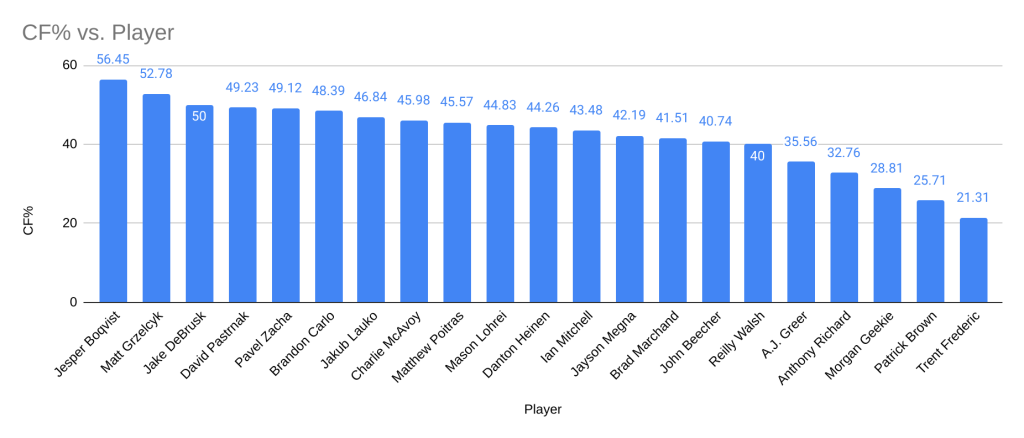
Corsi For Percentage by Player
CF% is an excellent metric used to evaluate puck possession; it measures every kind of shot made in the direction of the net. Unlike shots on goal, these shots don’t always result in a save from a goalie. The shot could have been blocked or gone wide, but the intention was a shot toward the goal.
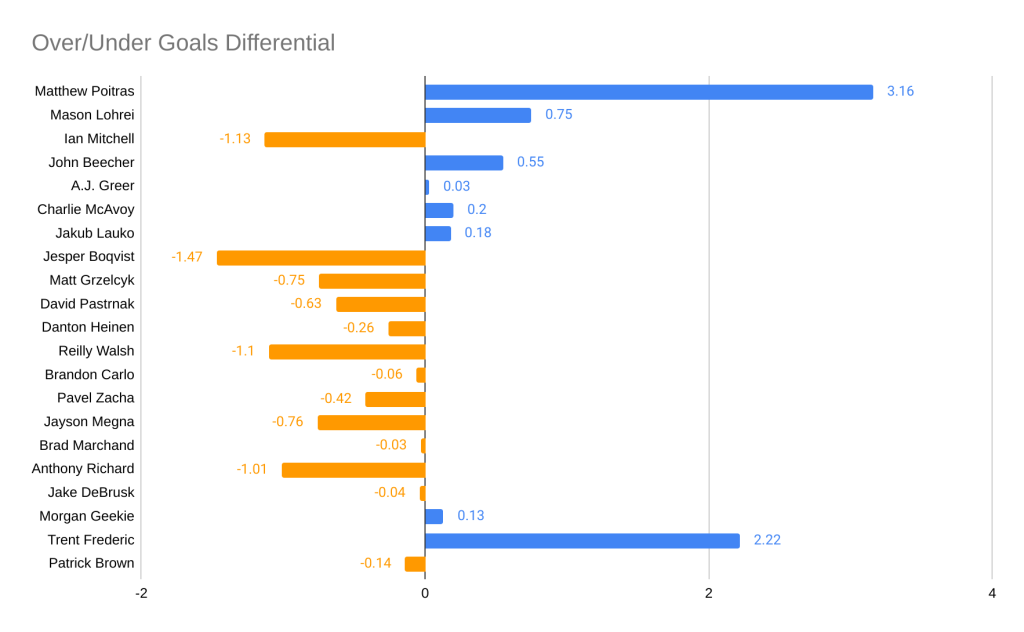
Goal Scoring Expectations
If CF% looks at the quantity of shot attempts, Expected Goals (xG) looks at the quality of shots; xG, however, is a team-level or game-level statistic. A better way to evaluate an individual player is by the Individual Expected Goals statistic (ixG). Both types of xG perform as predictors, but xG looks at the team’s overall ability to generate scoring opportunities, while ixG evaluates the player’s individual contribution to those opportunities.
You can see the difference between these two stats below. The first graph represents the over/under difference between the count of goals actually scored by players and their xG.
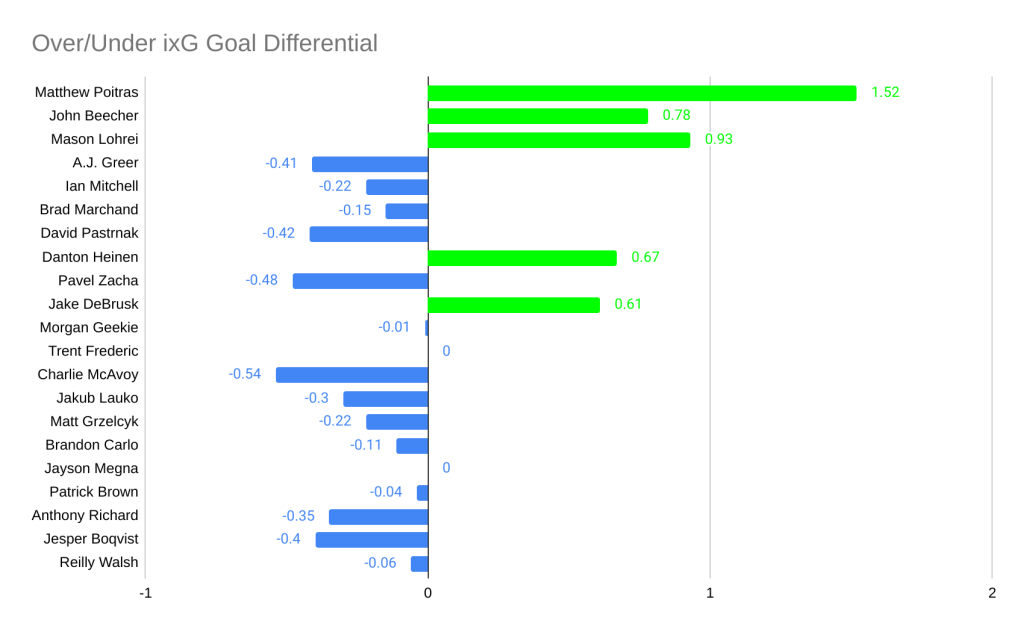
This graph represents that same over/under differential concept, but with the ixG metric instead. You can see how much the individual player’s contributions impacted their ixG count. In the above graph, Jake DeBrusk’s differential was -0.04. But at an individual level, his differential was a +0.61. I can now draw the conclusion that whichever game or games he scored in were ones where the team probably didn’t perform particularly well or generate many scoring opportunities. But because he scored, as an individual, he performed better by this metric.
Relative Individual Points Percentage
If you’ve been reading my posts for a while, You know how much I love the IPP. This is another way to measure a player’s contribution to the game. For forwards, the average IPP score is about 63%, and around 30% for defensemen. To create the graph below, I broadly evaluated how each player performed in multiple scenarios: all strengths, even strength, power play (PP), and penalty kill (PK).
Hypothetically, every player should have a statistic for all strengths and presumably for even strength. When it comes to special teams, some players are used more than others in various situations, so I am presenting the data as a percent to indicate how many players had average, above average, or below average IPP ratings out of the total number of players who had a rating.
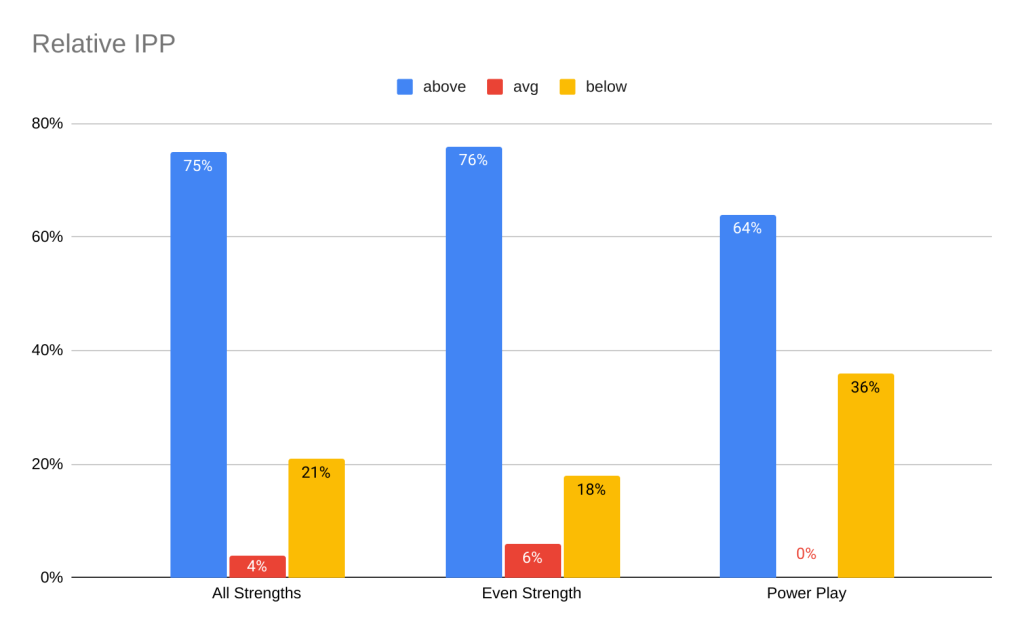
You may notice that there are only three groups above. That’s because there were no ratings for any player, except Trent Frederic, at the PK strength. I wonder if this was a data issue because they certainly went on the PK during the pre-season and the way the data was presented would indicate that no data was available, not that everyone scored a 0% IPP.
That all being said, it’s good to see that a majority of players who are out on the ice with the potential to earn an IPP score are rating above average – even if only 71%, 58%, and 4% of the team had an IPP in all, even, and PP strengths, respectively. Stay tuned for more updates as the season kicks off!


Leave a Reply